Figures & data
Figure 1 Presented are the calculated respiratory exchange ratios (RER) over the 90 minute cycling time-course of 15–20, 20–30, 35–45, 50–60, 65–75 and 80–90 minutes for each of the three experimental conditions.
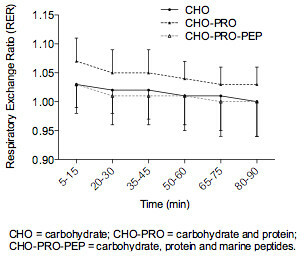
Table 1 Heart rate (mean ± SD) in bpm over the 90 minute cycling time-course of 0–5, 15–20, 30–35, 45–50, 60–65, 75–80 and 90 minutes for each of the three experimental conditions
Table 2 Blood glucose and lactate (mean ± SD) profile over the 90 minute cycling time-course of 0–5, 15–20, 30–35, 45–50, 60–65, 75–80 and 90 minutes for each of the three experimental conditions
Supplemental material