Figures & data
Figure 1 Salivary Cortisol (ug/ml). Salivary cortisol was 18% lower (p<0.05) in the Relora group compared to Placebo at Week 4 (0.525+ 0.190 to 0.642+ 0.353).
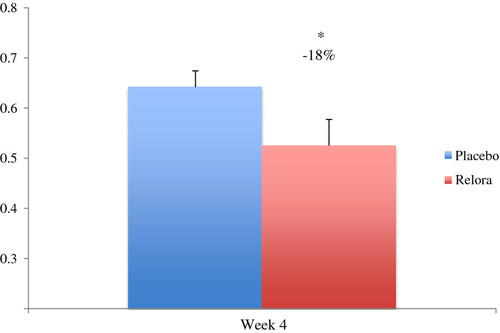
Figure 2 Global Mood State (POMS) and Overall Stress (Yale Stress Survey). Global Mood State was 11% better (p<0.05) in the Relora group compared to Placebo (118+ 18 to 133+ 30) – lower score is a “better” Global Mood State (POMS). Overall Stress (Yale Stress Survey) was 11% lower (p<0.05) in the Relora group compared to Placebo (30.2+ 5.2 to 33.9+ 7.4). The global mood state was calculated based on scoring (0-4 with 0 = not at all, 2 = moderately and 4 = extremely) answers to 58 of the 65 adjectives of the POMS (a lower number is a “better” global mood state). Global Mood State is the combined score of the 6 subscales of the POMS (McNair et al.,[Citation9]).

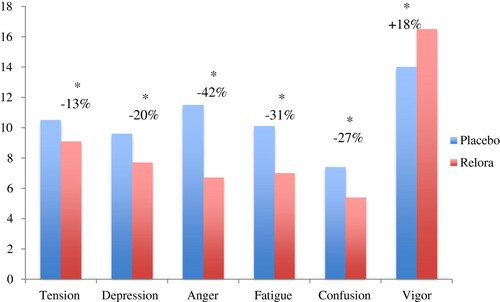
Figure 3 Profile of Mood States (POMS). Numerical scores for each of the 6 subscales of the POMS (McNair et al.,[Citation9]). The Relora group showed significantly improved mood state parameters compared to Placebo at Week 4 (* = p<0,05).