Figures & data
Table 1 Diets compositions
Figure 1 Creatine concentration (CR) in the liver the animals at the end of the experiment. The results are expressed as the mean + S.E. of 10 animals per group. TCr = Trained creatine; T = Trained; CCr = Control Creatine; C = Control not trained. ‡ different T/C.
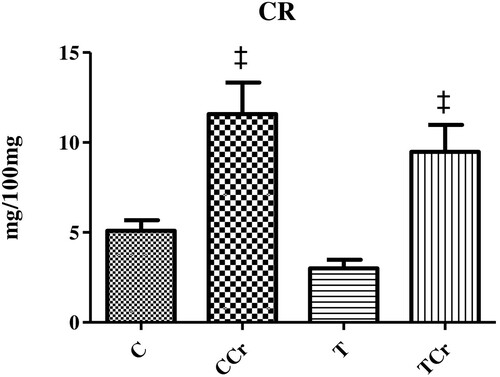
Figure 2 Analysis of pro-oxidants. A) Concentration of H2O2 B) Concentration of TBARs. The results are expressed as the mean + S.E. of 10 animals per group. TCr = Trained Creatine; T = Trained; CCr = Control Creatine; C = Control not trained ** different C e CCr.
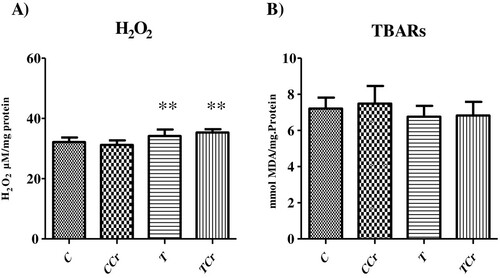
Figure 3 Analysis of antioxidants. A) Activity of SOD; B) GSH-GPx and C) CAT. The results are expressed as the mean + S.E. of 10 animals per group. TCr = Trained Creatine; T = Trained; CCr = Control Creatine; C = Control not trained. * different C; † different CCr; ‡ different T/C.
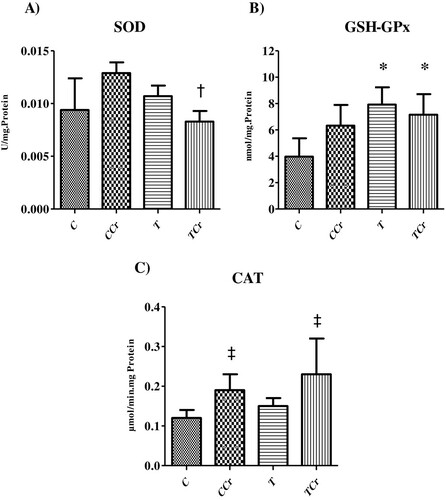
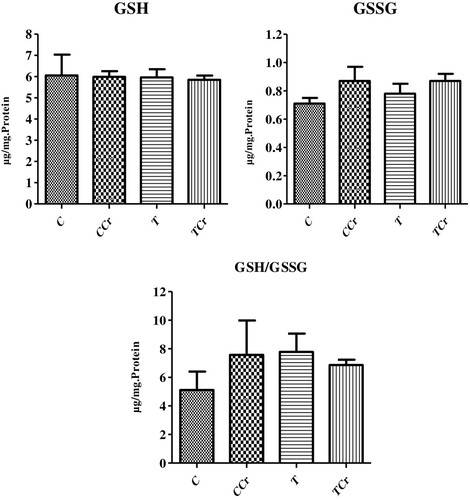
Figure 4 Concentration of reduced glutathione, oxidized glutathione and ratio reduced glutathione/oxidized glutathione in the liver the animals at the end of the experiment. The results are expressed as the mean + S.E. of 10 animals per group. TCr = Trained Creatine; T = Trained; CCr = Control Creatine; C = Control not trained.