Figures & data
Table 1 Carbohydrate (CHO), protein (PRO) and fat content of dietary interventions for carbohydrate (CHO) and carbohydrate and whey protein isolates (CHO + WPI)
Table 2 Amino acid profile of whey protein isolate supplement used in the sports beverages
Table 3 Nutritional information for the sports beverage
Table 4 Oligonucleotide primers for ‘Real – Time’ PCR primers
Figure 1 Plasma glucose concentration for carbohydrate (CHO) and carbohydrate and whey protein isolates (CHO + WPI) trials. The exercise trial day consisted of 60 min cycling at 70% VO2 max, with blood samples taken at rest and every 20 min (rest, 20, 40, 60). This was followed by time to fatigue at 90% VO2 max and blood was taken on completion of this effort (0). The 6 h recovery consisted of blood taken regularly for the first h (10, 20, 30, 40, 60) and every 60 min after that (120, 180, 240, 300, 360). Both CHO and CHO + WPI trials were significantly increased on completion of cycling at 90% VO2 max and remained elevated compared to rest until 40 min during recovery in the CHO + WPI trial (# P < 0.05). Whilst the CHO group remained elevated compared to rest until 60 min during recovery (* P < 0.05). Values are means ± SEM (n = 6).
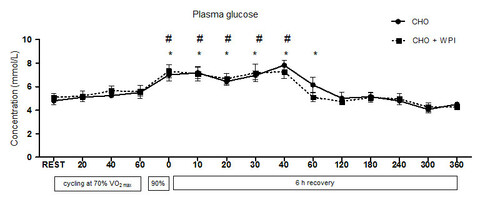
Figure 2 Plasma insulin concentration for carbohydrate (CHO) and carbohydrate and whey protein isolates (CHO + WPI) trials. The exercise trial day consisted of 60 min cycling at 70% VO2 max, with blood samples taken at rest and every 20 min (rest, 20, 40, 60). This was followed by time to fatigue at 90% VO2 max and blood was taken on completion of this effort (0). The 6 h recovery consisted of blood taken regularly for the first h (10, 20, 30, 40, 60) and every 60 min after that (120, 180, 240, 300, 360). Both trials, CHO (* P < 0.05) and CHO + WPI (# P < 0.05), were significantly elevated compared to rest, with CHO + WPI significantly higher than CHO at 180 min (^ P < 0.05) during the recovery period, before returning to resting levels at 240 min. Values are means ± SEM (n = 6).
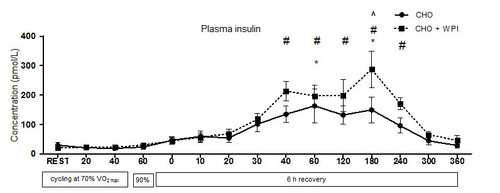
Figure 3 Muscle glycogen concentration following the 16 day dietary intervention and exercise trial day, which consisted of a resting (rest) muscle biopsy, another following 60 min cycling at 70% VO 2 max (70%) , time to fatigue at 90% VO 2 max (90%) and at the end of 6 h recovery (6 h recovery). Carbohydrate (CHO) and carbohydrate and whey protein isolates (CHO + WPI) trial were similar at rest. All time points following exercise were lower than rest in both trials (# P < 0.05). CHO + WPI trial was increased from 90% VO2 max to end of 6 h recovery (* P < 0.05). Values are means ± SEM (n = 6).
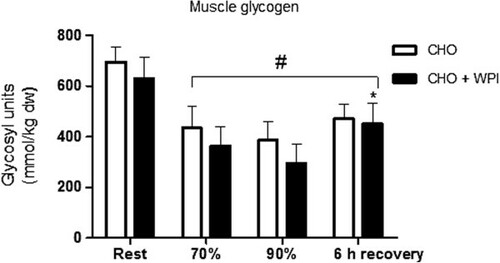
Figure 4 Glycogen synthase mRNA expression for the carbohydrate (CHO) and carbohydrate and whey protein isolates (CHO + WPI) trials. No differences were observed. Values are means ± SEM (n = 6).
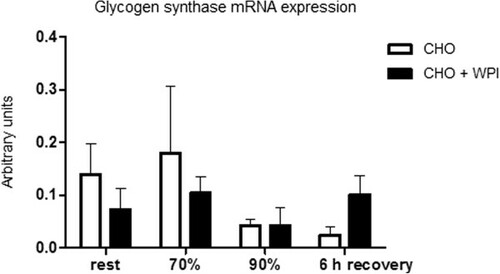
Figure 5 AMPK-α2 mRNA expression for carbohydrate (CHO) and carbohydrate and whey protein isolates (CHO + WPI) trials. CHO group is significantly different from rest to 90% and rest to end recovery (* P < 0.05). Values are mean ± SEM (n = 6).
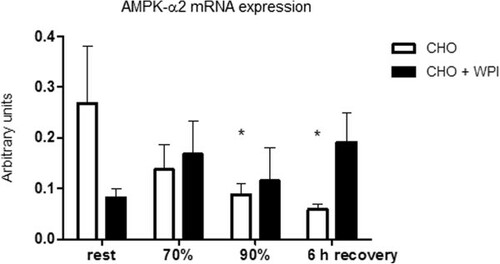
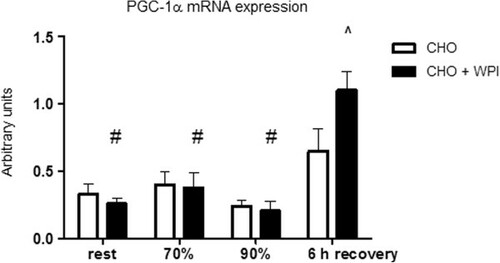
Figure 6 PGC-1α mRNA expression for carbohydrate (CHO) and carbohydrate and whey protein isolate trials (CHO + WPI) following 16 day dietary intervention and exercise trial. Muscle biopsies were taken at rest, another following 60 min cycling at 70% VO2 max (70%), time to fatigue at 90% VO2 max (90%) and at the end of 6 h recovery (6 h recovery). CHO + WPI trial was significantly lower at rest, following cycling at 70% and 90% VO2 max, compared to 6 h recovery (# P < 0.05). After 6 h of recovery the CHO + WPI trial was significantly increased compared to CHO trial (^P < 0.05). Values are mean ± SEM (n = 6).