
Figures & data
Figure 1 Concentric power output for each set during the resistance training session (HTS) when AOX or placebo was ingested (mean ± SEM). Statistically significant difference (*p < 0.05 and **p < .001) between the AOX and placebo trials.
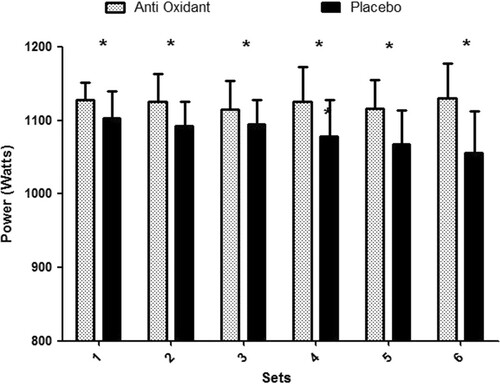
Figure 2 Velocity (m.s) during each set of the resistance training session (HTS) when AOX or placebo was ingested (mean ± SEM). Statistically significant difference (*p < 0.05 and **p < .001) between the AOX and placebo trials.
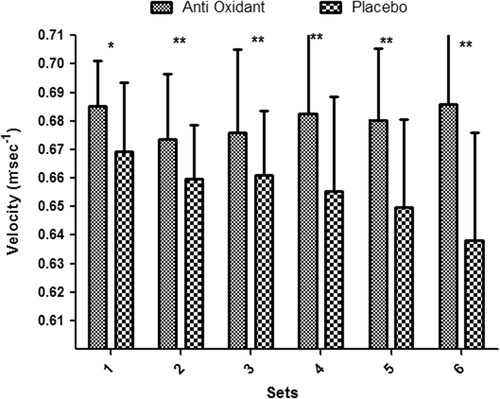
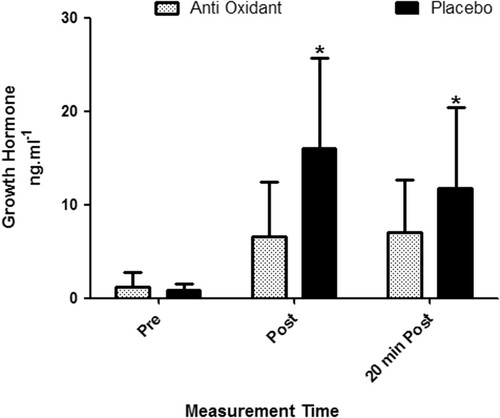
Figure 3 Growth hormone (GH) in response to the AOX and placebo HTS (mean ± SEM). Statistically significant difference (*p < 0.05 ) between the AOX and placebo trials.
Supplemental material