Figures & data
Figure 1 Maximum strength gain after 8 weeks of intervention. a) Absolute maximum strength gain related to the first to fourth tests of One Maximum Repetition (1MR); b) Relative maximum strength gain related to the first to fourth tests of One Maximum Repetition (1MR). Values in mean ± SD; n = 10 for all groups. SED, sedentary rats; SED-Cr, sedentary supplemented with creatine rats; RT, resistance training rats; RT-Cr, resistance training supplemented with creatine rats. Two way ANOVA, followed by the post hoc test of Student Newman-Keuls. *P < 0.001 vs. SED; †P < 0.001 vs. SED-Cr, RT; ‡P < 0.05 vs. SED, SED-Cr.
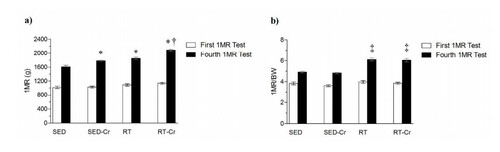
Figure 2 Oxidative stress in plasma after 8 weeks of intervention. Concentrations of a) MDA in plasma; b) SOD activity in plasma; and c) CAT activity in plasma. Values in mean ± SD; n = 10 for all groups. SED, sedentary rats; SED-Cr, sedentary supplemented with creatine rats; RT, resistance training rats; RT-Cr, resistance training supplemented with creatine rats. Two way ANOVA, followed by the post hoc test of Student Newman-Keuls. *P < 0.05 vs. SED; †P < 0.05 vs. RT; ‡P < 0.05 vs. all groups.
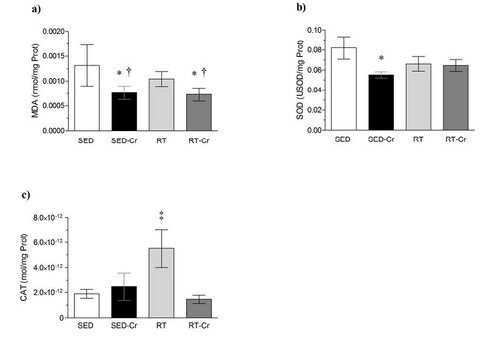
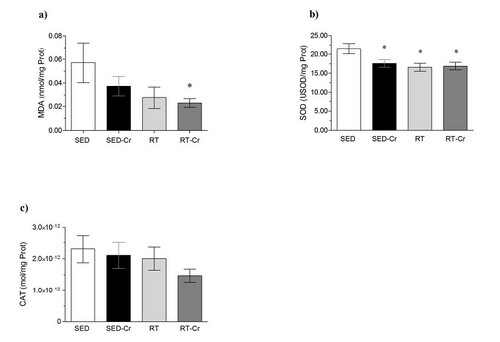
Figure 3 Oxidative stress in heart after 8 weeks of intervention. Concentrations of a) MDA in heart; b) SOD activity in heart; and c) CAT activity in heart. Values are mean ± SD; n = 10 for all groups. SED, sedentary rats; SED-Cr, sedentary supplemented with creatine rats; RT, resistance training rats; RT-Cr, resistance training supplemented with creatine rats. Two way ANOVA, followed by the post hoc test of Student Newman-Keuls. *P < 0.05 vs. SED; †P < 0.05 vs. RT; ‡P < 0.05 vs. RT-Cr; §P < 0.05 vs. SED-Cr.
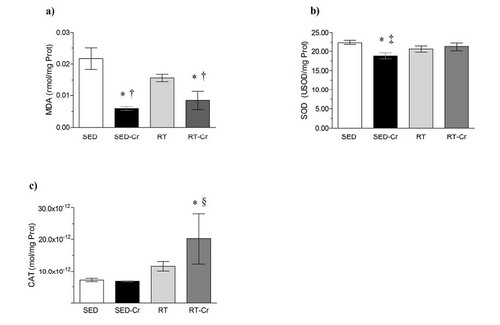
Figure 4 Oxidative stress in liver after 8 weeks of intervention. Concentrations of a) MDA in liver; b) SOD activity in liver; and c) CAT activity in liver. Values in mean ± SD; n = 10 for all groups. SED, sedentary rats; SED-Cr, sedentary supplemented with creatine rats; RT, resistance training rats; RT-Cr, resistance training supplemented with creatine rats. Two way ANOVA, followed by the post hoc test of Student Newman-Keuls. *P < 0.05 vs. SED; †P < 0.05 vs. RT-Cr; ‡P < 0.001 vs. all groups.
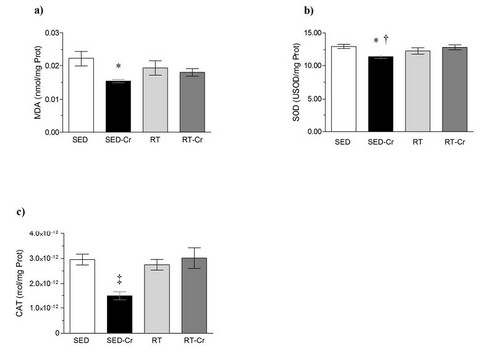
Figure 5 Oxidative stress in gastrocnemius after 8 weeks of intervention. Concentrations of a) MDA in gastrocnemius; b) SOD activity in gastrocnemius; and c) CAT activity in gastrocnemius. Values in mean ± SD; n = 10 for all groups. SED, sedentary rats; SED-Cr, sedentary supplemented with creatine rats; RT, resistance training rats; RT-Cr, resistance training supplemented with creatine rats. Two way ANOVA, followed by the post hoc test of Student Newman-Keuls. *P < 0.05 vs. SED.