
Figures & data
Figure 1 Absolute change in performance time for the responders (n = 5) and non-responders (n = 5) comparing acute (ACU) versus acute placebo (PLC-A) supplementation trials. Performance was significantly different in the ACU versus PLC-A (P < 0.05). Each line represents a different swimmer.

Table 1 Physical characteristics (mean ± SEM) of both the 5 responders and 5 non-responders
Figure 2 Post-trial lactate concentrations (mmol/L) of responders and non-responders. aSignificantly different (P < 0.05) from acute placebo trial (PLC-A). bSignificantly different (P < 0.05) from non-responders in the acute (ACU) trial. cSignificantly different (P < 0.05) from non-responders in the chronic (CHR) trial. Values are Mean ± SEM.
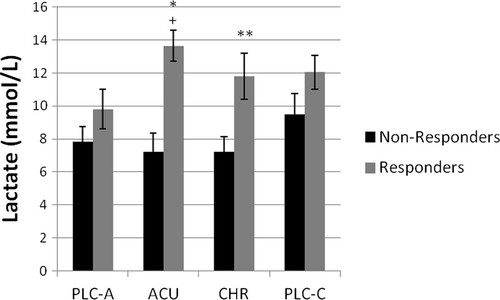
Figure 3 Base excess (BE) (mmol/L) at basal, post-ingestion, and post-trial time points for the acute placebo (PLC-A), acute (ACU), chronic (CHR) and chronic placebo (PLC-C) trials. aSignificant difference during post-ingestion (P < 0.05) between ACU and PLC-A. bSignificant difference during post-ingestion (P < 0.05) between CHR and PLC-C. cSignificant difference during basal (P < 0.05) between CHR and ACU. Significant time effects (P < 0.05) basal to post-ingestion in ACU and PLC-C. Significant time effects (P < 0.05) post-ingestion to post-trial in ACU, CHR, and PLC-C. Values are Mean ± SEM.
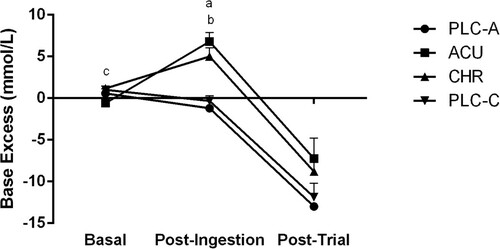
Figure 4 Bicarbonate concentration (mmol/L) at basal, post-ingestion, and post-trial time points for the acute placebo (PLC-A), acute (ACU), chronic (CHR) and chronic placebo (PLC-C) trials. aSignificant difference during post-ingestion (P < 0.05) between ACU and PLC-A. bSignificant difference during post-ingestion (P < 0.05) between CHR and PLC-C. Significant time effects (P < 0.05) basal to post-ingestion in ACU and PLC-C. Significant time effects (P < 0.05) post-ingestion to post-trial in ACU, CHR, and PLC-C. Values are Mean ± SEM.
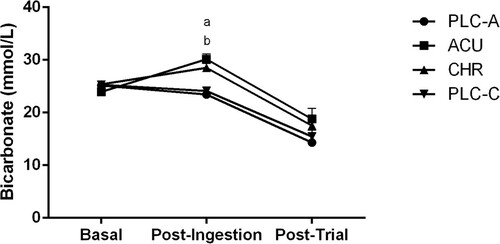
Figure 5 Blood pH at basal, post-ingestion, and post-trial time points for the acute placebo (PLC-A), acute (ACU), chronic (CHR) and chronic placebo (PLC-C) trials. Significant time effects (P < 0.05) from basal to post-ingestion. Trend to significance (P = 0.06) during post-ingestion between ACU and PLC-A. Values are Mean ± SEM.
