
Figures & data
Table 1 Concentrations of the minerals and trace elements in drinks used in the study
Table 2 Changes in body weight
Figure 1 Changes in maximum oxygen uptake during recovery. #p < 0.05 compared with control in the DMW condition; *p < 0.05 for the comparison between placebo and DMW.
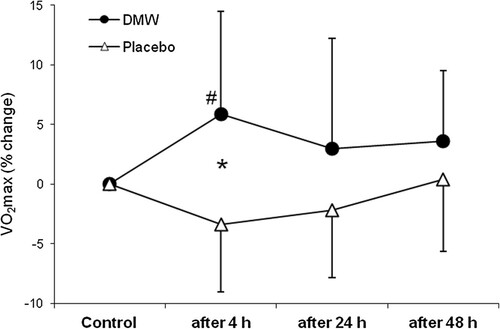
Figure 2 Changes in maximum oxygen pulse during recovery. *p < 0.05 between DMW and placebo trials.
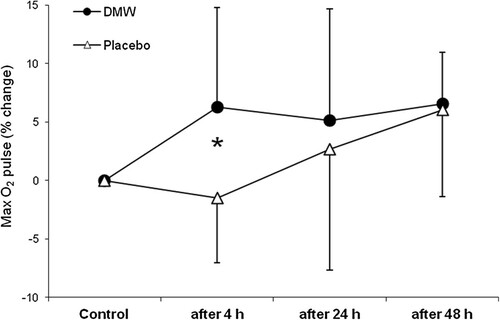
Figure 3 Changes in vertical jump height during recovery. #p < 0.05 during recovery in the DMW trial compared with control; \\p < 0.05 during recovery in the placebo trial compared with control; *p < 0.05 between the DMW and placebo trials.
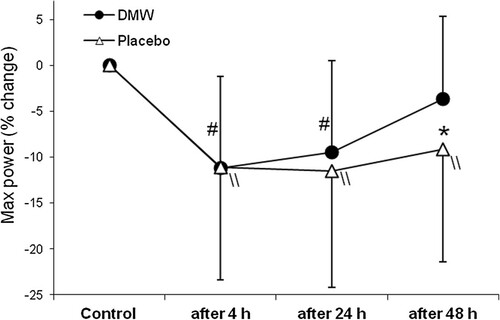
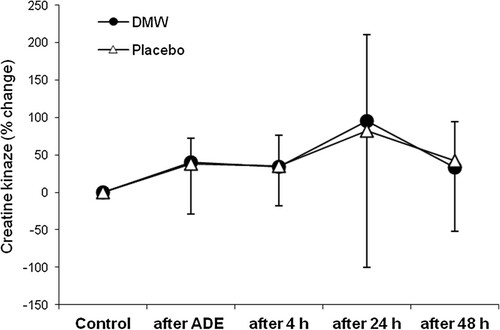
Figure 4 Changes in the activity of plasma creatine kinase during recovery.
Supplemental material