Figures & data
Table 1 Description of races, Nr – number of race, TR – temperature range, AT – average temperature, AH – average relative humidity, weather, P – precipitation, F - finishers, prevalence of EAH (R1,R2,R3,R4)
Table 2 Age, anthropometry, training, pre-race experience, and race performance of subjects (R1,R2,R3,R4), n = 53
Table 3 Characteristics of the three cases (EAH-A-R2, EAH-B-R3, EAH-C-R4) with exercise-associated hyponatremia (n = 3)
Table 4 Physical, blood and urine parameters before and after the race (n = 3)
Table 5 (A,B,C,D) - Changes in blood and urine parameters (R1,R2,R3,R4) in subjects without EAH, n = 50
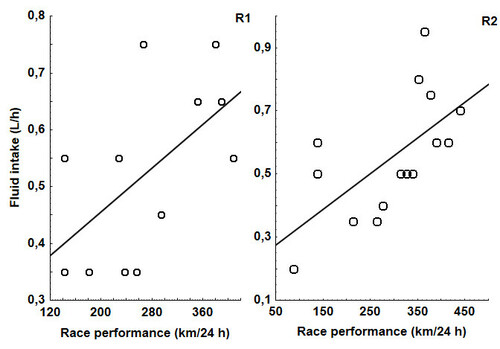
Figure 1 Fluid intake was positively related to race performance (R1: r = 0.58, p = 0.05; R2: r = 0.63, p = 0.01). R1: Czech Championship 24-hour MTB race‘ in Jihlava city, 24-hour MTB race, R2: ,Bike Race Marathon Rohozec 24 hours‘ in Liberec city, 24-hour MTB race.