
Figures & data
Figure 1 Concentrations of skeletal muscle total protein levels in standard diet (SD), exercise (EX), exercise plus standard diet for 72 hours (EX + SD), and exercise plus standard diet supplemented with hydrolyzed protein (2 g/kg/d) for 72 hours (EX + HP). EX + HP group presented significantly higher values than did the EX + SD and EX groups. *P < 0.05: Different from the EX + HP group.
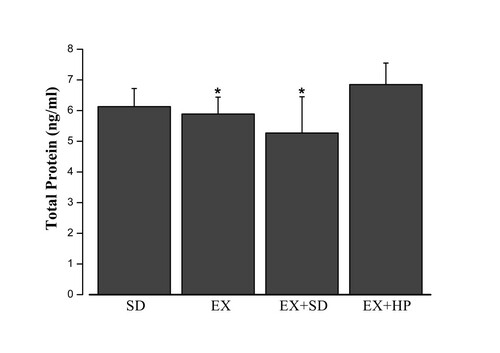
Figure 2 Concentrations of skeletal muscle malondialdehyde (MDA) levels in standard diet (SD), exercise (EX), exercise plus standard diet for 72 hours (EX + SD), and exercise plus standard diet supplemented with hydrolyzed protein (2 g/kg/d) for 72 hours (EX + HP). SD, EX and EX + HP groups presented significantly lower values than did the EX + SD group. *P < 0.05: Different from the EX + SD group.
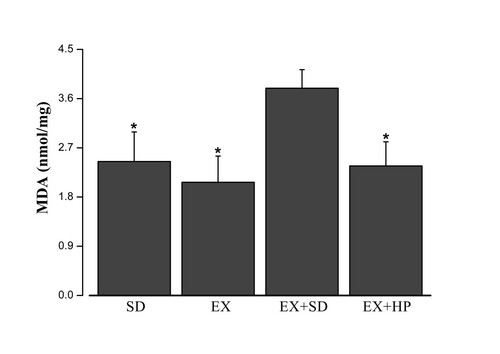
Figure 3 Concentrations of skeletal muscle protein carbonyl (PC) levels in standard diet (SD), exercise (EX), exercise plus standard diet for 72 hours (EX + SD), and exercise plus standard diet supplemented with hydrolyzed protein (2 g/kg/d) for 72 hours (EX + HP). EX + HP group presented significantly lower values than did the EX and EX + SD groups. EX + SD group presented significantly higher values than did the SD group.* P < 0.001: Different from the EX and EX + SD groups. # P < 0.001: Different from the SD group.
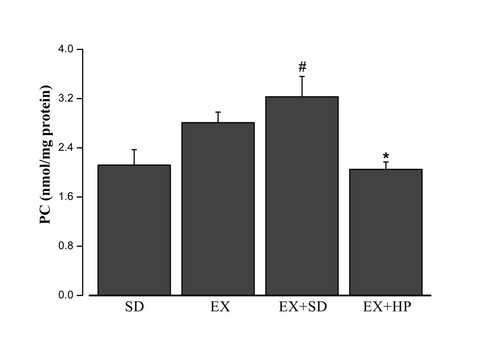
Table 1 The concentrations of plasma free amino acids (AA) of the rats among the standard diet group (SD), exercise group (EX), exercise plus standard diet for 72 h group (EX + SD), and exercise plus standard diet supplemented with hydrolyzed protein (2 g/kg/d) for 72 h group (EX + HP)