Figures & data
Table 1 Physical characteristics of the two groups of participants. Values are presented as the mean ± SD
Figure 1 Rectal temperature (top panel), mean skin temperature (middle panel) and mean body temperature (bottom panel) in the Cr (left side) and placebo (right side) supplemented groups. *: indicates a significant difference between pre (●) to post (○) supplementation. †: indicates a significant greater change in the Cr group compared with the placebo group (p < 0.05). Values are given as mean (SD).

Figure 2 RPE (breathing) (top panel) and RPE (legs) (bottom panel) in the Cr (left side) and placebo (right side) supplemented groups during exercise. *: indicates a significant difference between pre (●) to post (○) supplementation. Values are given as mean (SD).
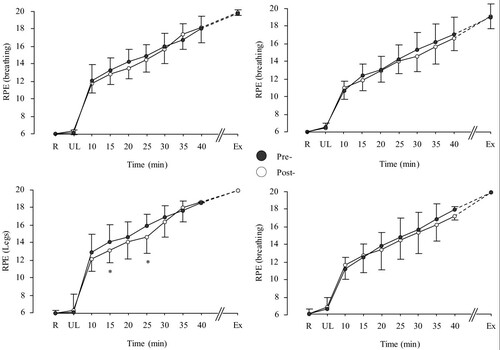
Table 2 Concentrations of total Trp, Tyr, LNAA and free-Trp before and after supplementation.
Table 3 Total Trp:LNAA, total Trp:Tyr, free-Trp:LNAA and free-Trp:Tyr ratios before and after supplementation.
Table 4 Concentrations of plasma prolactin and FFA before and after supplementation.