Figures & data
Table 1 Ingredients in an 8.5 g serving of greens+
Table 2 Mean PRAL scores (mEq) per 8.5 g serving of greens+; averaged over 10 samples.
Figure 1 Mean pH values +/- SEM before and during supplementation. pH during weeks 2 and 3 were significantly greater than during the baseline period (p = 0.031 and 0.032 respectively).
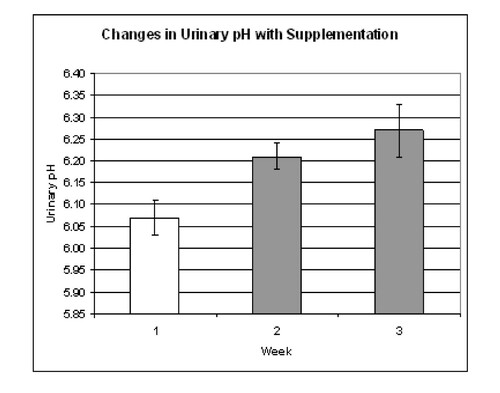
Table 3 Mean pH values before supplementation and during two-week supplementation period by subject.
Supplemental material