Figures & data
Table 1 The distribution of lottery funded athletes in the full and supplement user samples by sports and gender
Figure 1 Age distribution of male and female supplement user athletes (n = 520).
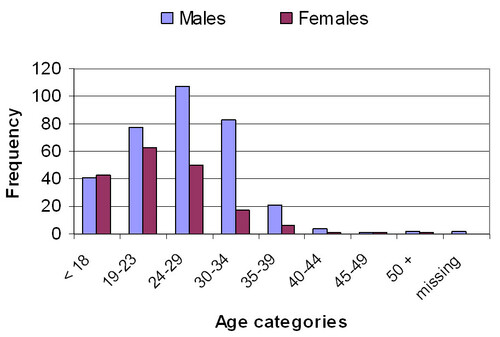
Figure 2 Comparison of relative percentage (Y-axis) of athlete subgroups in the full sample (n = 874) and supplement user sample (n = 520).
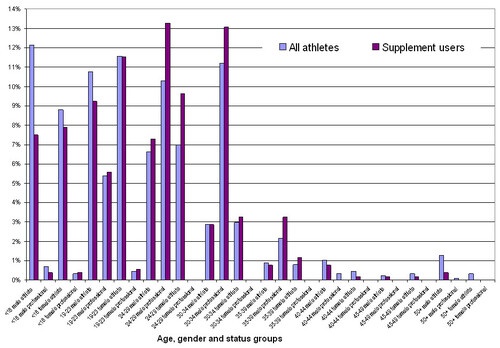
Figure 3 Relative use of nutritional supplements by age and status among male supplement users (n = 520).
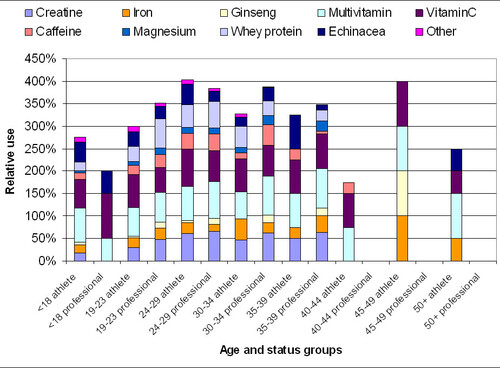
Figure 4 Relative use of nutritional supplements by age and status among female supplement users (n = 520).
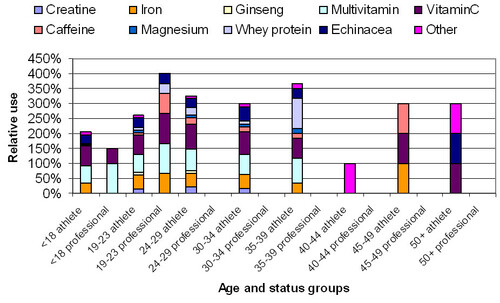
Figure 5 Relative percentage of each supplement used by gender (n = 520).
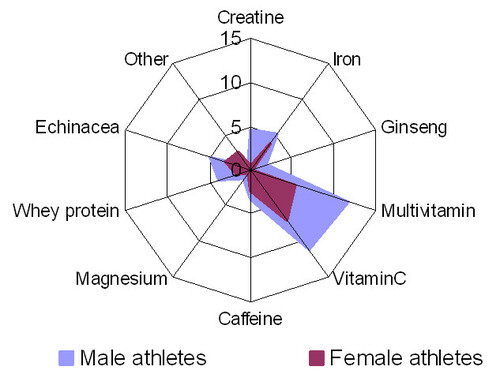
Table 2 Prevalence of multiple supplements use in the full sample (n = 874) and among supplement users (n = 520)
Supplemental material