Figures & data
Table 1 Anthropometrical data and blood values after overnight fast
Figure 1 Schematic presentation of the experimental set up. The working arm was in a horizontal position supported under the elbow. The handgrip had to be squeezed with the highest contraction frequency possible. The maximum displacement was 3 cm. The fan was used to reduce skin blood flow by cooling.
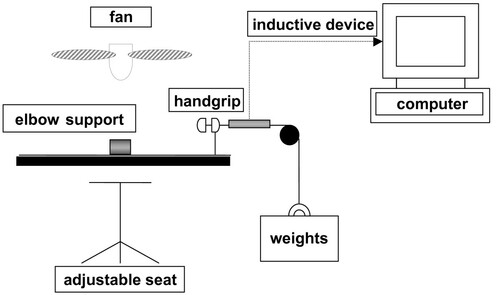
Figure 2 Forearm exercise started 45 min after the first blood sample had been taken. Exercise consisted of 10 maximal bouts of 15 sec separated by a 45 sec rest period. Timing of blood samples are indicated by small arrows (open arrow: pre exercise sample; filled arrow: post exercise sample).

Figure 3 Top: Mean power over all evaluated intervals was significantly improved with Cr-Pyr and Cr-Cit; middle: ratio of mean oxygen to mean power; bottom: Cr-Cit significantly improves ratio mean ammonia release to mean power (Left: pre supplementation, right: post supplementation, *** P < 0.001; * <0.02).
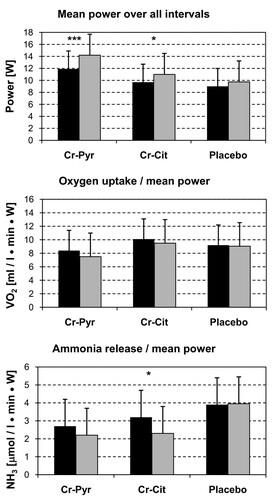
Table 2 Force and relaxation velocity.