Figures & data
Figure 1 Schematic diagram of research design.
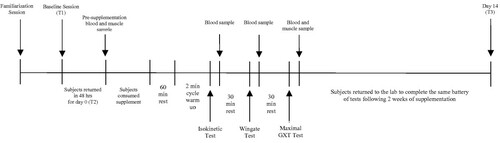
Table 1 Subject Baseline Characteristics
Table 2 Lipid Panels for the CoQ10 and Placebo (CON) groups.
Table 3 Nutritional Intake Analyses for the CoQ10 and Placebo (CON) groups.
Table 4 Body Composition Measurements for the CoQ10 and Placebo (CON) groups.
Table 5 Isokinetic Muscle Endurance Indices for the CoQ10 and Placebo (CON) groups.
Table 6 Wingate Anaerobic Power Indices for the CoQ10 and Placebo (CON) groups.
Table 7 Aerobic Power Indices for the CoQ10 and Placebo (CON) groups.
Table 8 Time Course of Markers of Oxidative Stress for the CoQ10 and Placebo (CON) subjects taken immediately after each performance test.
Figure 2 Time course of plasma CoQ10 concentration. Data (mean ± SD) represents total plasma CoQ10 concentration (ug/ml) for both CoQ10 and placebo control groups taken prior to, and immediately after each performance test on day 0 (T2) and day 14 (T3). † represents (p < 0.05) difference from control.
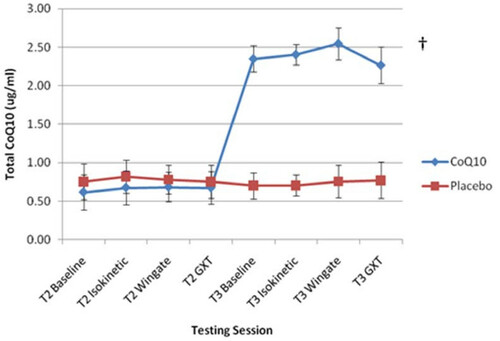
Figure 3 Time course of muscle CoQ10 concentration. Data (mean ± SD) represents total muscle CoQ10 concentration (ug/mg muscle) for both CoQ10 and placebo control groups taken pre and immediately post the final performance test on day 0 (T2) and day 14 (T3).
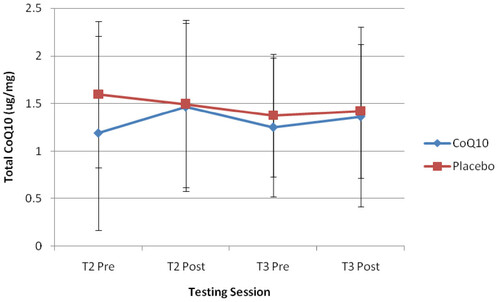
Table 9 Correlation Data with Baseline Plasma CoQ10 levels
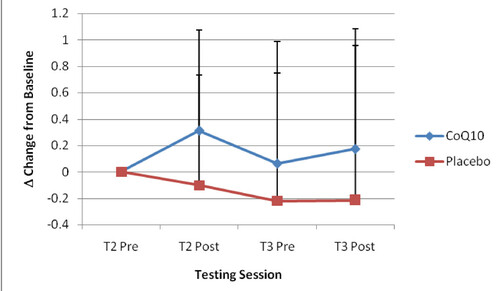
Figure 4 Delta changes from baseline for muscle CoQ10 concentration. Data (mean ± SD) represents delta scores (post minus pre values) for each performance test (Isokinetic, Wingate, Cardiopulmonary), both CoQ10 and placebo control groups on day 0 (T2) and day 14 (T3).