Figures & data
Table 1 Nutritional recall information placebo GPLC
Table 2 Exercise training volume placebo GPLC
Figure 1 Peak power (PP) determined during repeated cycling sprints with Placebo (dotted columns) and with GPLC (darkened columns). Note: Significant condition main effect (p < 0.01) and interaction effect (p < 0.05). Significant paired time contrasts for sprints 3, 4, and 5 (p < 0.05). Values are mean ± SD. * denotes statistically significant difference between conditions (p < 0.05)
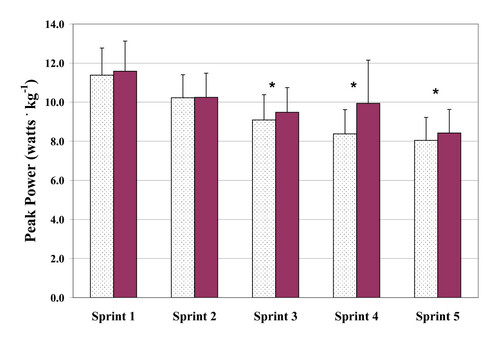
Figure 2 Mean power (MP) determined during repeated cycling sprints with Placebo (dotted columns) and with GPLC (darkened columns). Note: Significant interaction effect (p < 0.05). Significant paired time contrasts for sprints 4 and 5 (p < 0.05). Values are mean ± SD. * denotes statistically significant difference between conditions (p < 0.05)
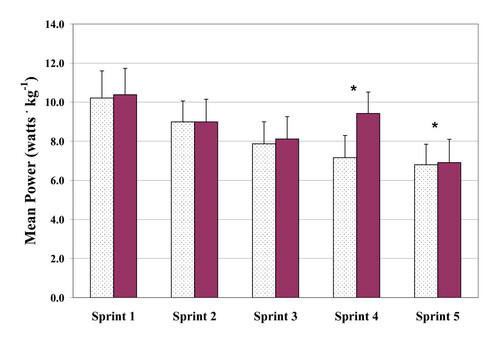
Figure 3 Decrement in power output (DEC) determined during repeated cycling sprints with Placebo (dotted columns) and with GPLC (darkened columns). Note: No significant main condition or interaction effects (p > 0.05). Significant paired time contrast for sprint 5 (p < 0.05). Values are mean ± SD
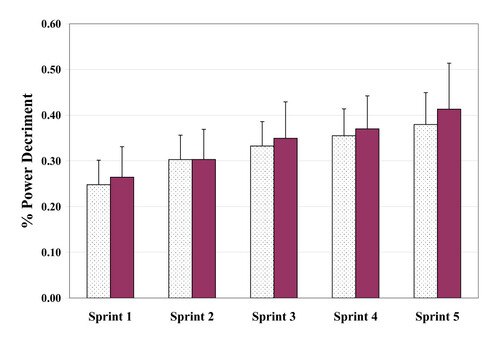
Figure 4 Lactate (PP) assessed during at rest and 4 min and 14 min following repeated cycling sprints with Placebo (dotted columns) and with GPLC (darkened columns). Note: Significant condition main effect (p < 0.05). Significant paired time contrast for 14 min post sprints (p < 0.05) but not 4 min post sprint (p = 0.09). * denotes statistically significant difference between conditions (p < 0.05)
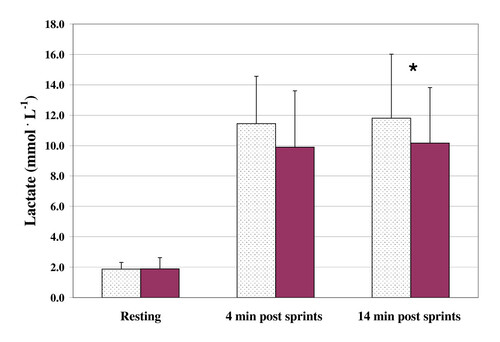
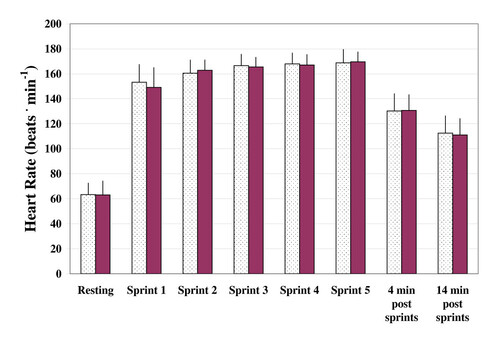
Figure 5 Heart rate (HR) assessed at rest, during and following repeated cycling sprints with Placebo (dotted columns) and with GPLC (darkened columns). Values are mean ± SD.