Figures & data
Table 1 Baseline age (yrs), height (cm), weight (kg) and body fat (%) characteristics.
Figure 1 Study Timeline.
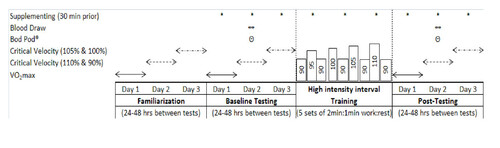
Table 2 Pre-workout supplement ingredients for the active (GT) and placebo (PL) groups.
Figure 2 Mean percent change scores ± 95% confidence intervals for (A) critical velocity, (B) anaerobic running capacity, (C) aerobic capacity, (D) percent body fat, (E) lean body mass, and (F) fat mass. Black circles = GT group; White circles = PL group. * indicates a significant difference when 0 is outside of the 95% confidence interval.
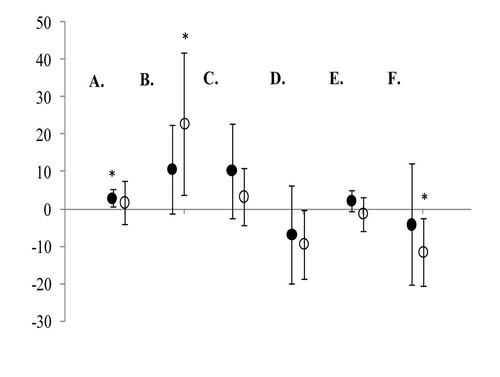
Figure 3 Percent change scores from pre- to post-training for each individual participant for (A) critical velocity, (B) anaerobic running capacity, (C) aerobic capacity, (D) percent body fat, (E) fat mass and (F) lean body mass. Black circles = GT group; White circles = PL group.
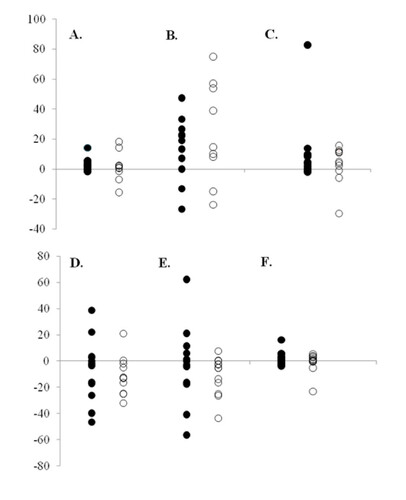
Table 3 Mean ± SE values from pre- to post-training for critical velocity (CV), anaerobic running capacity (ARC), maximal oxygen consumption (VO2max), percent body fat (%BF), fat mass (FM) and lean body mass (LBM) for GT and PL.
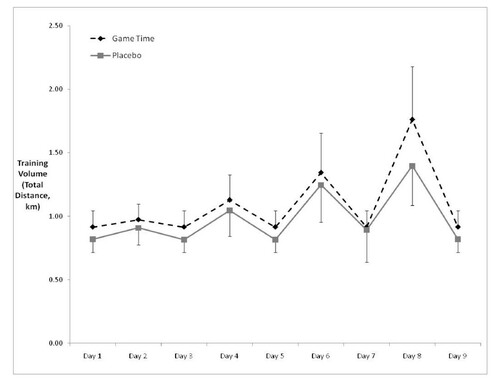
Figure 4 Training volume for the GT and PL groups across the nine day training session.