Figures & data
Table 1 Prescribed Training Regimen
Table 2 Comparison of Beverage Ingredients
Table 3 Daily Averages in Training Data
Figure 1 Serum CK and Mb levels following Increased Training Duration. Data reported are means/standard error. [* = significantly different (p < 0.05) than CHO; # = significantly different than PreITD].
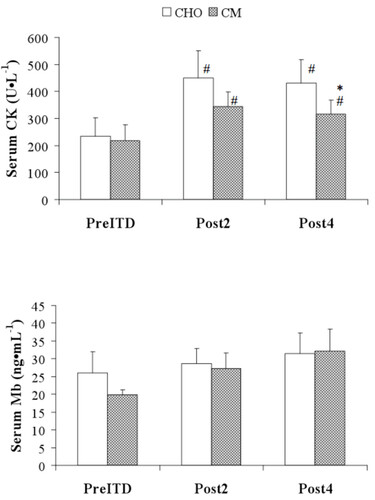
Figure 2 MVC levels following Increased Training Duration. Data reported are means/standard error. [# = significantly different (p < 0.05) than PreITD].
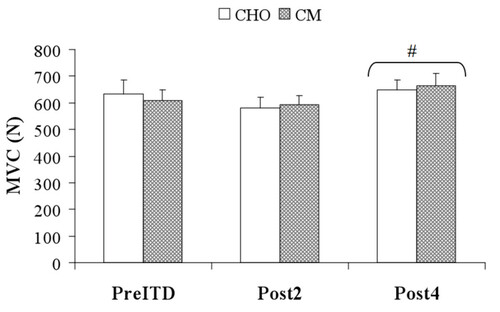
Table 4 Subjective Ratings of Muscle Soreness and Energy/Fatigue following Increased Training Duration
Table 5 Performance Tests
Supplemental material