Figures & data
Table 1 Subject characteristics.
Table 2 Summary of the training program before and during the training camp.
Table 3 Post-intense endurance exercise blood values expressed as a percentage of the pre-intense endurance exercise values.
Figure 1 Hematological parameters in the subjects pre- and post-intense endurance exercise on the initial (A, C, E) and final (B, D, F) days of the training camp. Open and closed bars show the P and CT groups, respectively. Graphs A and B show mean levels of WBC counts, graphs C and D show mean levels of neutrophil counts and graphs E and F show mean levels of lymphocyte counts for pre- and post-intense endurance exercise. Values are means ± SEM. *, **, and *** Indicate significant difference (p < 0.05, p < 0.01, and p < 0.001, respectively).† Indicates tendency for a difference (p < 0.1).
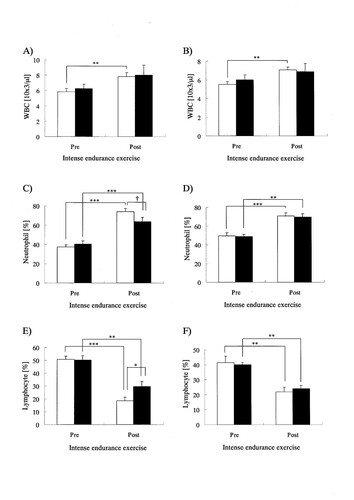
Figure 2 Blood biochemical parameters in the subjects pre- and post-intense endurance exercise on the initial (A, C) and final (B, D) days of the training camp. Open and closed bars show the P and CT groups, respectively. Graphs A and B show mean levels of CPK and graphs C and D show mean levels of Mb for pre- and post-intense endurance exercise. Values are means ± SEM. *, **, and *** Indicate significant difference (p < 0.05, p < 0.01, and p < 0.001, respectively).
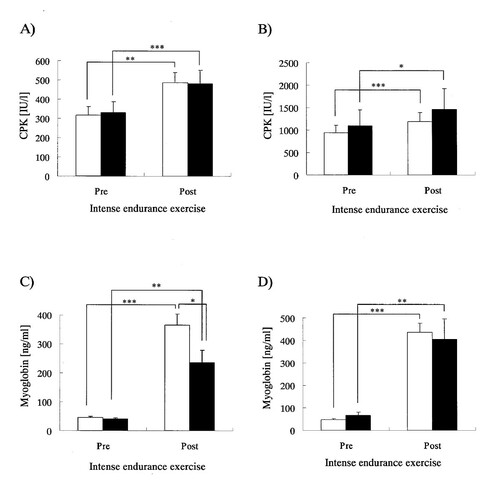
Figure 3 Blood cytokine and salivary stress hormone levels in the subjects pre- and post-intense endurance exercise on the initial (A, C) and final (B, D) days of the training camp. Open and closed bars show the P and CT groups, respectively. Graphs A and B show mean levels of blood IL-6 and graphs C and D show mean levels of salivary cortisol for pre- and post-intense endurance exercise. Values are means ± SEM. * and *** Indicate significant difference (p < 0.05 and p < 0.001, respectively).
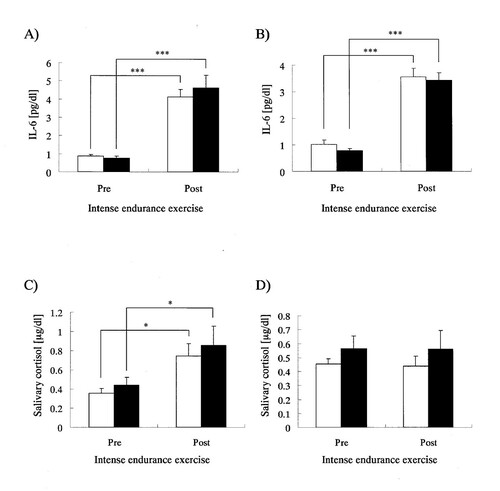
Table 4 Associations among intense exercise-induced responses of immune cells and index for muscle damage.