Figures & data
Table 1 Four-week Testing Phase timeline for the consumption of bottled waters by Control and Experimental groups.
Table 2 Weekly blood and urine collection and water pickup schedule during the 4-week Testing Phase.
Table 3 Summary of demographic data for study participants (Mean ± SD (Range)).
Table 4 Water consumption and physical activity for study participants reported as Mean ± SE (Range).
Figure 1 Changes in 24-hour urine output (L/day) across the three study periods. Changes are shown relative to the very first collection (i.e., urine measurement 1, or M1). Individual values were calculated as a difference between the measured value at each of the 12 measurements and the measured value at M1. Values marked with an asterisk (*) differed significantly from the M1 reference value of zero liters (P < 0.05). Short dashed lines represent one-side SE bars.
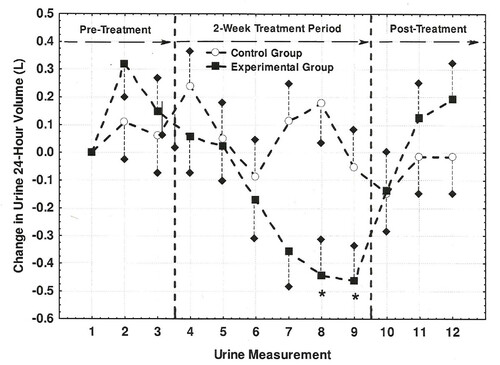
Table 5 Summary statistics of sub-group analysis variables reported as Mean ± SD (Range).
Table 6 Urine Osmolality for the Control group with daily PA, SRWC, and PRAL subgroup analyses (Mean (SE)).
Table 7 Urine Osmolality for the Experimental group with daily PA, SRWC, and PRAL subgroup analyses (Mean (SE)).
Table 8 Urine pH for the Control group with daily PA, SRWC, and PRAL subgroup analyses (Mean (SE)).
Table 9 Urine pH for the Experimental group with daily PA, SRWC, and PRAL subgroup analyses (Mean (SE)).
Figure 2 Changes in fingertip blood osmolality across the three study periods. Blood osmolality values correspond each of twelve (i.e., M1-M12) fingertip collections. Values marked with an asterisk (*) differed significantly from the M1 reference values of 335 and 352 mOsm/kg for the Control and Experimental groups, respectively (P < 0.05). Short dashed lines represent one-side SE bars.
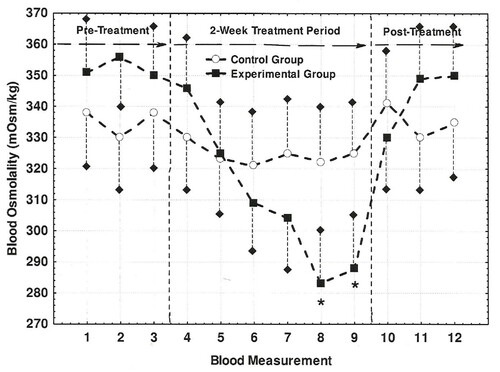
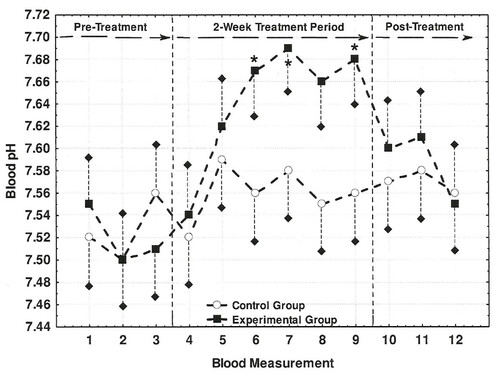
Figure 3 Changes in fingertip blood pH across the three study periods. Blood pH values correspond each of twelve (i.e., M1-M12) fingertip collections. Values marked with an asterisk (*) differed significantly from the M1 reference values of 7.53 and 7.52 for the Control and Experimental groups, respectively (P < 0.05). Short dashed lines represent one-side SE bars.