Figures & data
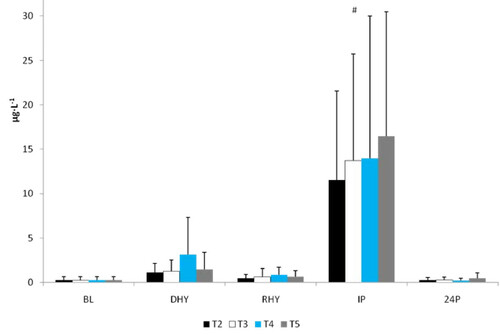
Figure 1 Plasma Glutamine Concentrations. There was a significant main effect for trial between T2 and T5. # = significant main effect for time versus BL and DHY; a = significantly different from T2, T3, and T4.
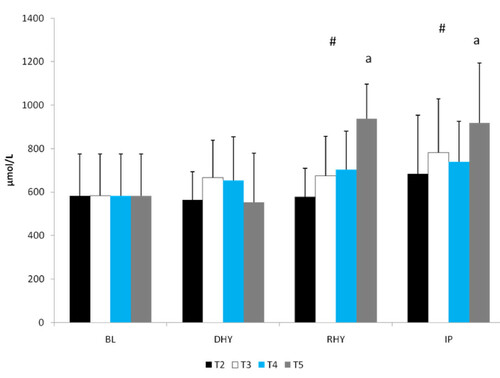
Figure 2 AUC Glutamine. * = Significantly different from T2
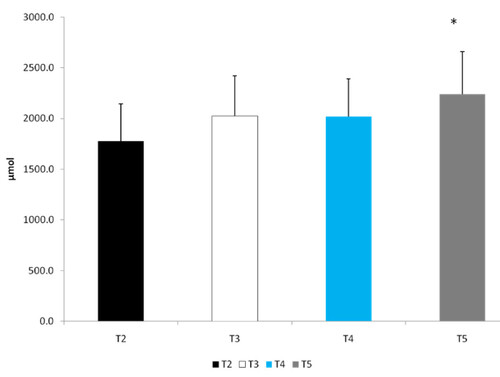
Figure 3 Time to Exhaustion. * Significantly different from all other trials.
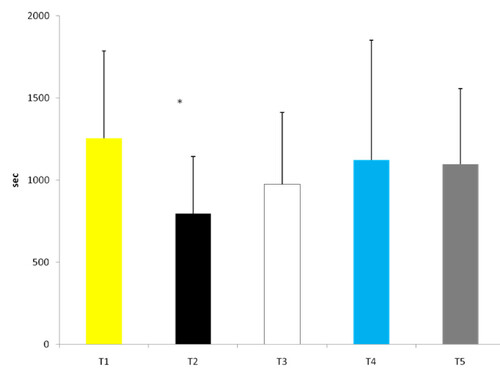
Figure 4 Δ Time to Exhaustion. * = Significantly different from ΔT2
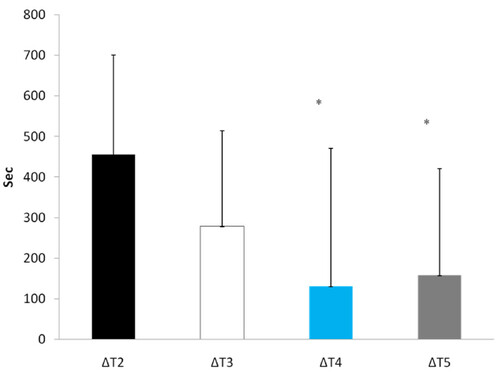
Table 1 Cardiovascular Changes during Exercise Protocol
Table 2 Plasma Lactate, Glucose, Osmolality and Electrolyte Response to Exercise
Figure 5 Serum Aldosterone Response. # = significant main effect for time between BL and DHY.
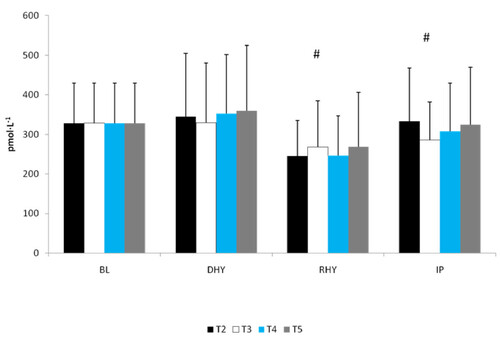
Figure 6 Arginine Vasopressin. # = significant main effect for time BL versus DHY, RHY and IP. * = Significant main effect between DHY and IP.
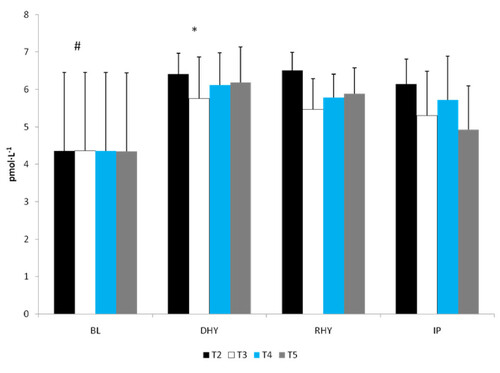
Figure 7 C-Reactive Protein Response. * = significant main effect for time BL.
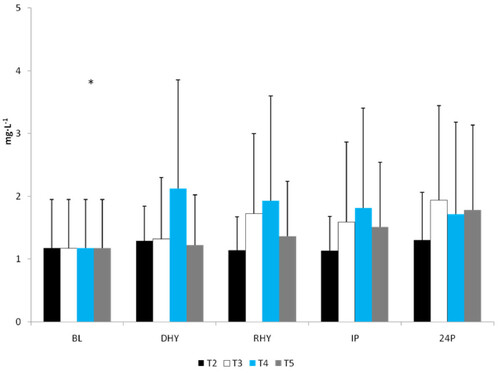
Figure 8 IL-6 Response. # = significant main effect for time versus BL, DHY and 24P; * significant main effect for time versus BL and 24P.
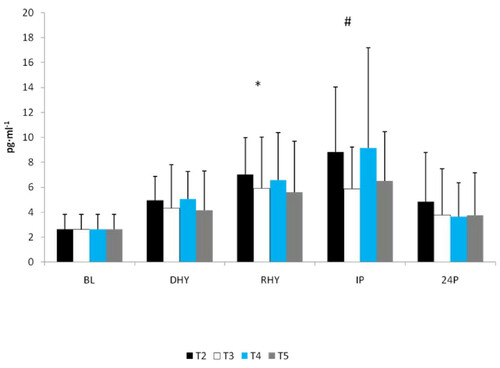
Figure 9 MDA Response. # = significant main effect for time versus DHY, RHY, IP, and 24P; There was a significant main effect for Trial between T3 and T5 versus T2 and T4.
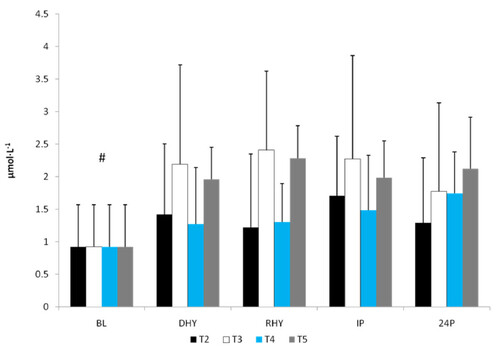
Figure 10 Testosterone Response.
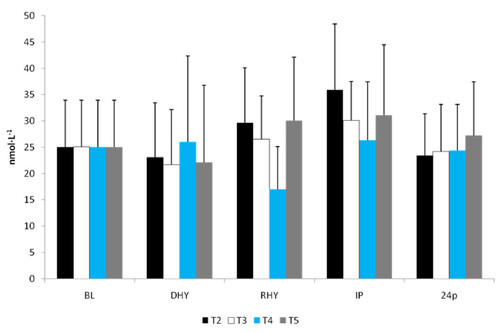
Figure 11 ACTH Response. # = significant main effect for time versus BL, DHY and RHY
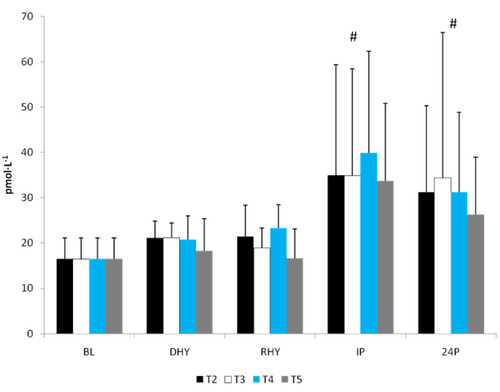
Figure 12 Cortisol Response. # = significant main effect for time versus BL, DHY and RHY
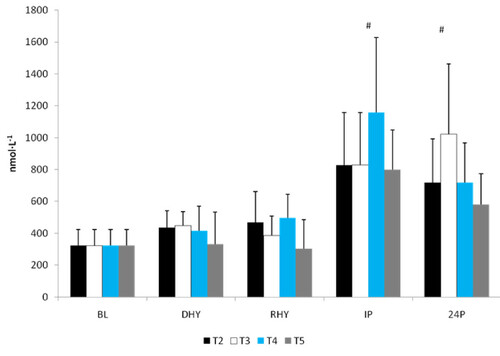
Figure 13 Growth Hormone Response. # = significant main effect for time versus BL, DHY RHY, and 24P