Figures & data
Table 1 3-day dietary analysis recall (mean ± SD)
Figure 1 Time to exhaustion (individual responses, A and mean values, B) after the ingestion of LGI, HGI and control meals (mean ± SEM). LGI: Low Glycemic Index; HGI: High Glycemic Index.
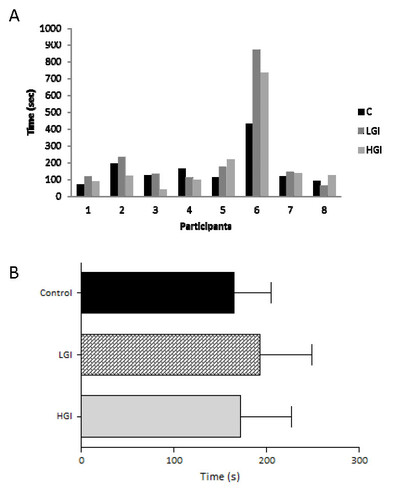
Figure 2 RPE, heart rate and ventilation responses during exercise after the ingestion of LGI, HGI and control meal (mean ± SEM). LGI: Low Glycemic Index; HGI: High Glycemic Index.a Significantly different from 10 for the HGI group (P < 0.05),b Significantly different from 10 for the LGI group (P < 0.05),c Significantly different from 10 for the control group (P < 0.05).
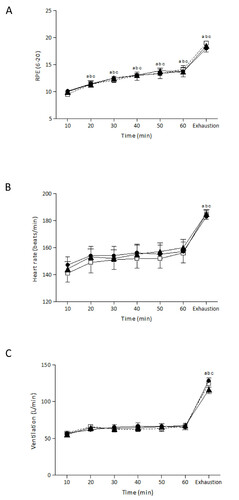
Figure 3 Respiratory quotient and substrate oxidation rate during exercise after the ingestion of LGI, HGI and control meal (mean ± SEM). LGI: Low Glycemic Index; HGI: High Glycemic Index.a Significantly different from 10 for the HGI group (P < 0.05),b Significantly different from 10 for the LGI group (P < 0.05),c Significantly different from 10 for the control group (P < 0.05).
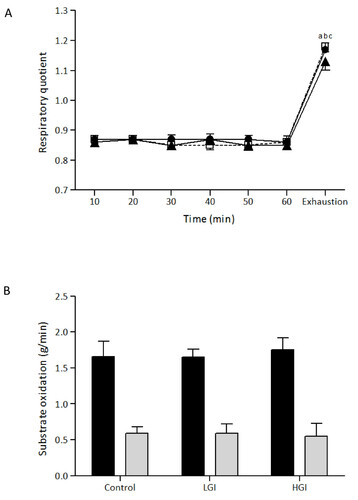
Figure 4 Lactate, glucose and insulin responses during exercise after the ingestion of LGI, HGI and control meal (mean ± SEM). LGI: Low Glycemic Index; HGI: High Glycemic Index.a Significantly different from the first time point for the HGI group (P < 0.05),b Significantly different from the first time point for the LGI group (P < 0.05),c Significantly different from the first time point for the control group (P < 0.05);d significantly different between HGI and control group at the same time point (P < 0.05).
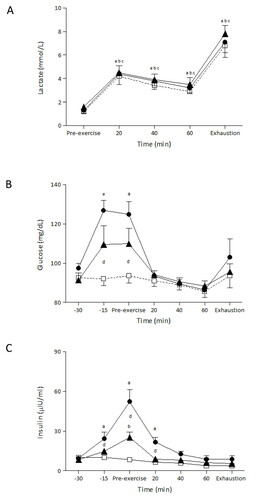
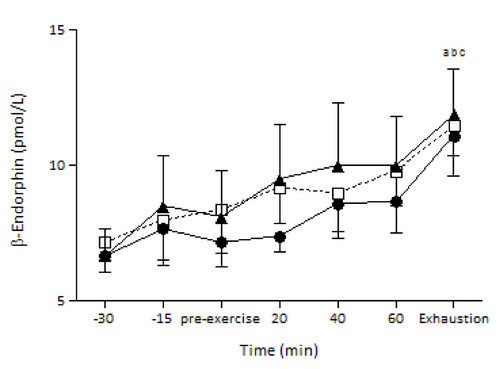
Figure 5 β-Endorphin responses during exercise after the ingestion of LGI, HGI and control meal (mean ± SEM). LGI: Low Glycemic Index; HGI: High Glycemic Index.a Significantly different from -30 for the HGI group (P < 0.05),b Significantly different from -30 for the LGI group (P < 0.05),c Significantly different from -30 for the control group (P < 0.05).