Figures & data
Table 1 This table shows demographic and strength data of the study participants.
Figure 1 Calculation speed. Data are presented as seconds per correct calculation on the SST. * The PS group scored significantly lower at PRE compared to the PL group but not after exercise (p = 0.007).
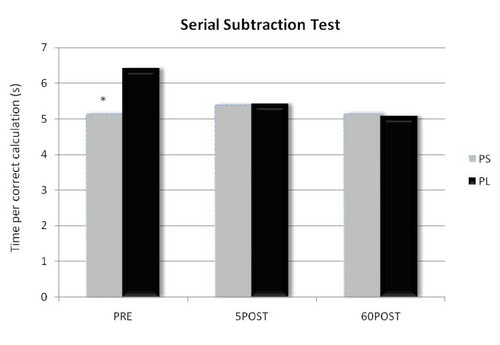
Figure 2 This figure shows the mean POMS scores from both supplement groups combined to illustrate the effect exercise had on mood data. There were no significant differences between supplement groups for POMS data (p > 0.05).
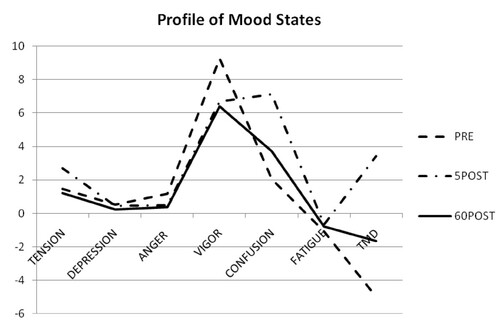
Table 2 This table shows serum levels of total testosterone (ng/mL) and cortisol (μg/dL).
Supplemental material