Figures & data
Figure 1 Magnetic resonance images of the right thigh and upper arm for a single subject pre- and post-training. Thigh and arm scan were obtained using axial T1-weighted spin-echo images with repetition time of 750 ms, echo time of 20 ms, 230 × 290 matrix resolution and number of excitations of two. Thigh images were obtained perpendicular to the femur starting at the proximal femoral epiphysis (tangential to its proximal end) and proceeding distally toward the knee joint. The slice thickness was 8 mm with no gap (forty slices) with a 45 × 45 cm field of view (FOV). Upper arm images were obtained perpendicular to the humerus starting at the proximal humeral epiphysis (tangential to its proximal end) proceeding distally toward the elbow joint. The slice thickness was 6 mm with a 1.2 mm interslice gap (forty slices) with a FOV of 40 × 32 or 40 × 40 cm depending on the arm's size.
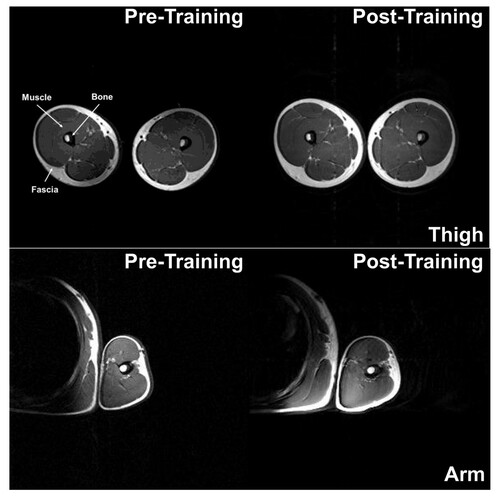
Figure 2 Bench press total training volume at each week of training (mean ± SD). CI = constant rest interval group; DI = decreasing rest interval group. * = significant difference between the groups. # = significant difference to 1st week. + = significant difference to 2nd week. § = significant difference to 3rd week. @ = significant difference to 4th week.

Figure 3 Squat total training volume at each week of training (mean ± SD). CI = constant rest interval group; DI = decreasing rest interval group. * = significant difference between the groups. # = significant difference to 1st week. + = significant difference to 2nd week. § = significant difference to 3rd week. @ = significant difference to 4th week.
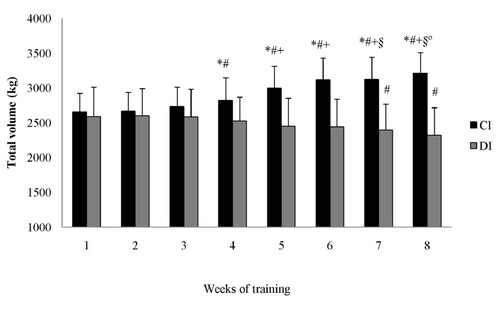
Table 1 One repetition maximum loads (mean ± SD) and Effect Sizes for bench press and squat exercises.
Table 2 Isokinetic knee flexor and extensor peak torque (N.m) values (mean ± SD) and Effect Sizes.
Table 3 Muscle cross-sectional area of the upper arm (CSAA) and right thigh (CSAT) values (mean ± SD) and Effect Sizes.