Figures & data
Figure 1 Schematic representation of the experimental protocol.
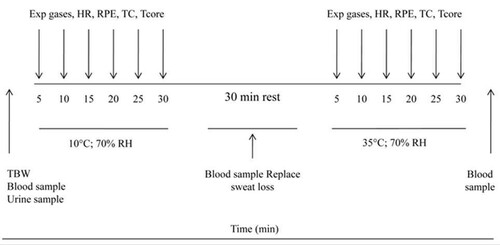
Figure 2 Rating of perceived exertion (RPE) during exercise at 10 and 35°C before (black circles) and after (white circles) supplementation. Data presented as mean ± SD.

Figure 3 Thermal comfort (TC) during exercise at 10 and 35°C before (black circles) and after (white circles) supplementation. Data presented as mean ± SD.

Figure 4 Changes in body mass (BM), total body water (TBW), extracellular water (ECW) and intracellular water (ICW) induced by supplementation. Data presented as mean ± SD. *Significant difference between pre- and post-supplementation. The units for Δ body composition are kg for BM and L for body water compartments.

Table 1 Oxygen consumption , carbon dioxide production
, respiratory exchange ratio (RPE) during 30 min of running at 10 and 35°C conducted before and after supplementation.
Figure 5 Heart rate (HR) during exercise at 10 and 35°C before (black circles) and after (white circles) supplementation. Data presented as mean ± SD. *Significant difference between pre- and post-supplementation.

Figure 6 Core temperature (T core ) during exercise at 10 and 35°C before (black circles) and after (white circles) supplementation. Data presented as mean ± SD. *Significant difference between pre- and post-supplementation.
