Figures & data
Table 1 Exercise training program schedule.
Table 2 Body and carcass weights.
Figure 1 Lean body mass composition and the exercise factor. (A) percentage of protein, (B) percentage of fat, (C) percentage o water. Data are mean ± SD (% of carcass weight, independent of supplementation). n, number of animals. *, denotes significant differences from sedentary animals (P < 0.05).
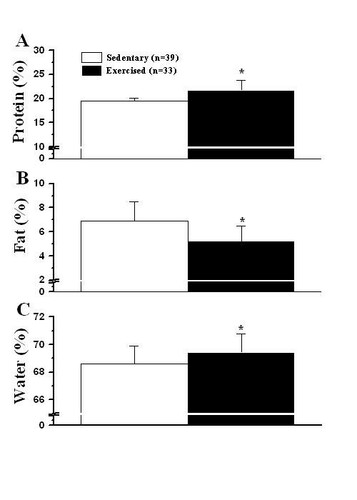
Figure 2 Lean body mass composition and the supplementation factor. (A) percentage of protein, (B) percentage of fat, (C) percentage o water. Data are mean ± SD (% of carcass weight, independent of exercise). Pl, placebo (n = 19 animals). Cr, creatine (n = 17 animals). Caf, caffeine (n = 18 animals). CrCaf, creatine plus caffeine (n = 18 animals). *, denotes significant difference from Cr groups (P < 0.05).
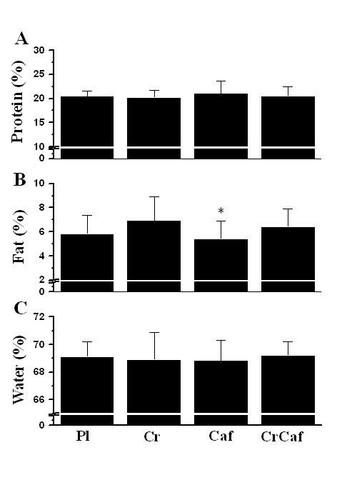
Table 3 Urinary creatinine.