Figures & data
Table 1 Physical characteristics of the Ethiopian runners
Table 2 Estimated daily energy expenditure according to Physical Activity Ratio
Figure 1 Macronutrient intake (g and percent intake) (mean ± standard deviation) over the 7 day period.
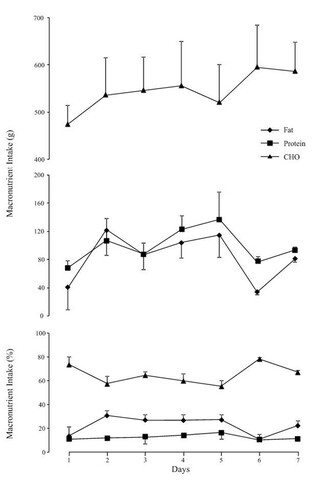
Figure 2 Individual ranges of macronutrient intake (average for the 7 day period).
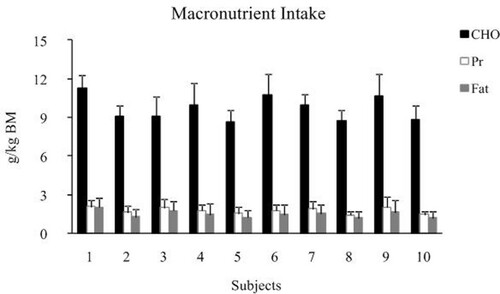
Table 3 Food Sources as a percentage of daily intake of each macronutrient
Supplemental material