Figures & data
Table 1 Subject Characteristics
Figure 1 Perceived Protein Needs. The recommended protein intake (RDI), maximum beneficial level of protein intake, and the mean perceived protein needs, as determined by protein menu selection, in grams of protein per kg of body weight per day.
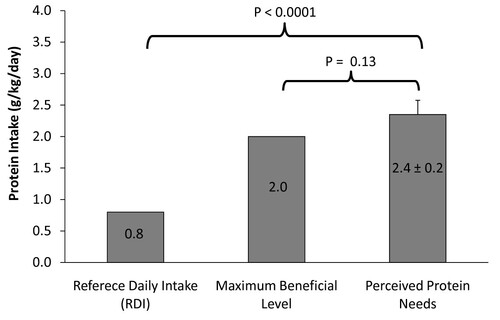
Figure 2 Actual Protein Intake. The RDI, maximum beneficial level of protein intake, and the mean actual protein intake as determined by 3-day food record analysis in grams of protein per kg of body weight per day.
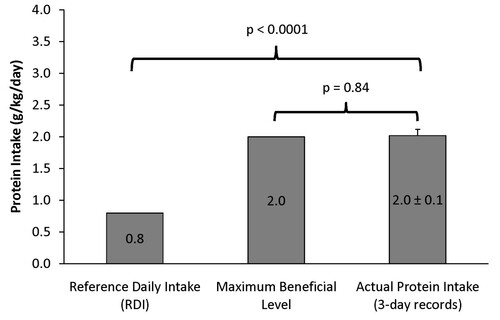
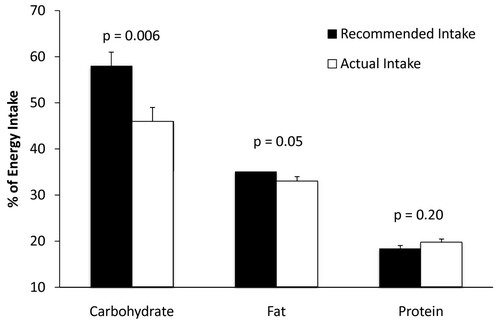
Figure 3 Recommended vs. Actual Macronutrient Intake. The recommended macronutrient distribution for athletes compared to measured macronutrient intakes. Recommended carbohydrate intake was calculated as a percentage of total energy intake based on the minimum recommended carbohydrate intake for athletes (i.e. 6 g/kg/d) [Citation9], body weight, and total energy intake. The upper limit for fat intake was set at 35% based on recommendations [Citation9]. Recommended protein intake was calculated as a percentage of total energy intake based on the upper end of the recommended range for protein intake athletes (i.e. 1.7 g/kg/d) [Citation9], body weight, and total energy intake.