Figures & data
Table 1 Characteristics of the subjects (n = 76).
Table 2 Results of the physical, haematological and urinary parameters before and after the race.
Figure 1 Range of changes in foot volume.
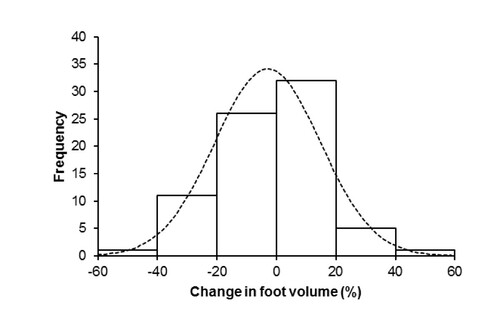
Table 3 Data for each individual who was hyponatremic post-race
Figure 2 The change in body mass was significantly and negatively related to the change in plasma [Na + ] ( r = -0.35, p = 0.0023).
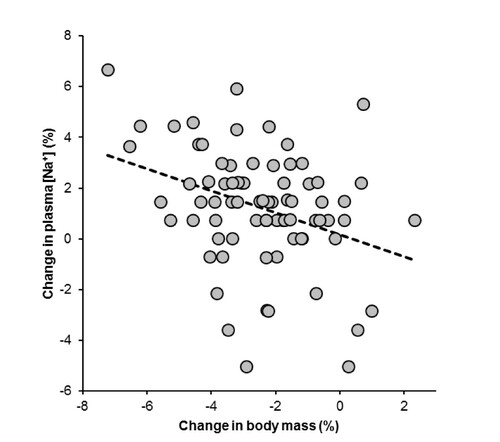
Figure 3 The change in body mass was significantly and negatively related to running speed ( r = -0.34, p = 0.0028).
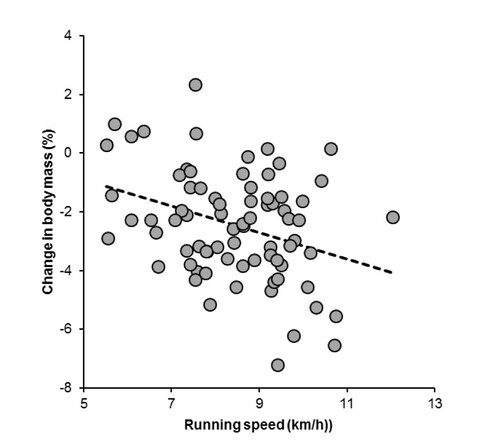
Figure 4 Range of fluid intake.
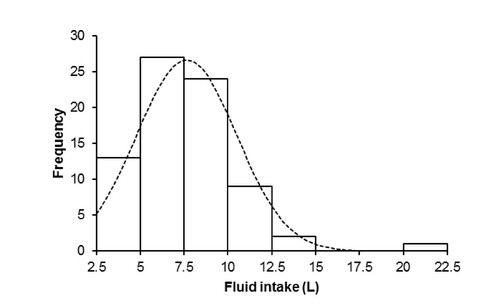
Figure 5 Fluid intake was significantly and negatively related to post-race plasma [Na + ] ( r = -0.28, p = 0.0142).
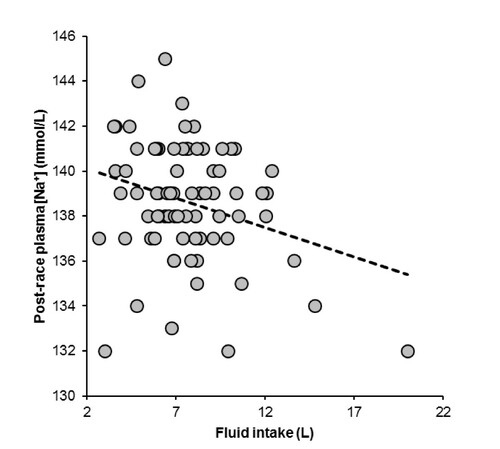
Figure 6 Fluid intake was significantly and negatively related to running speed ( r = -0.33, p = 0.0036).
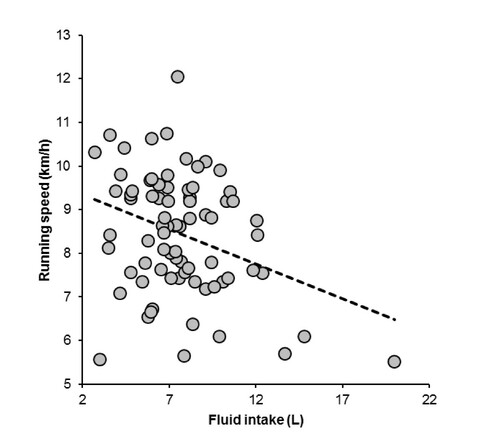
Figure 7 The change in the volume of the right foot was significantly and negatively related to running speed ( r = -0.23, p = 0.0236).
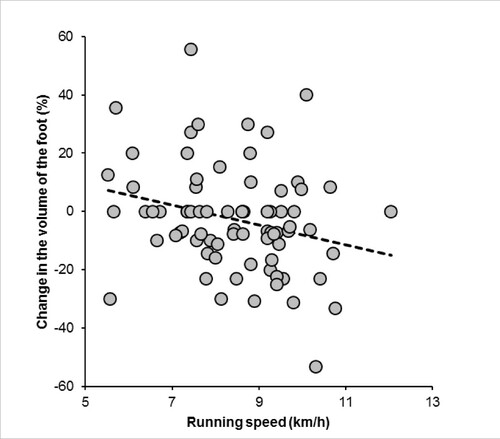
Figure 8 Fluid intake was significantly and positively related to the change in the volume of the right foot ( r = 0.54, p < 0.0001).
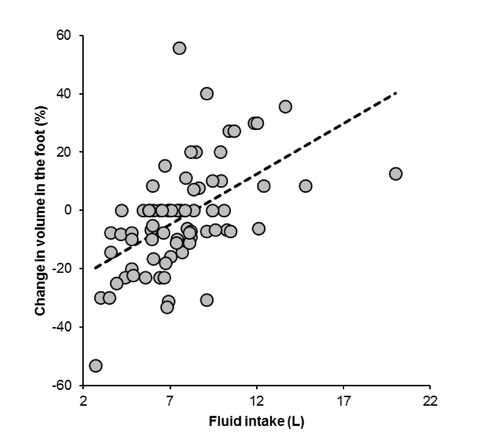
Figure 9 The change in the volume of the right foot was significantly and negatively related to the change in plasma [Na + ] ( r = -0.26, p = 0.0227).
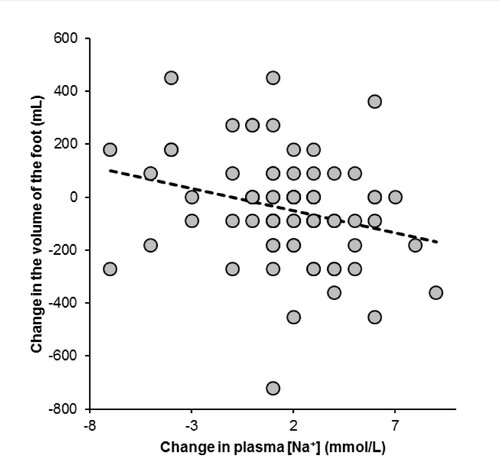
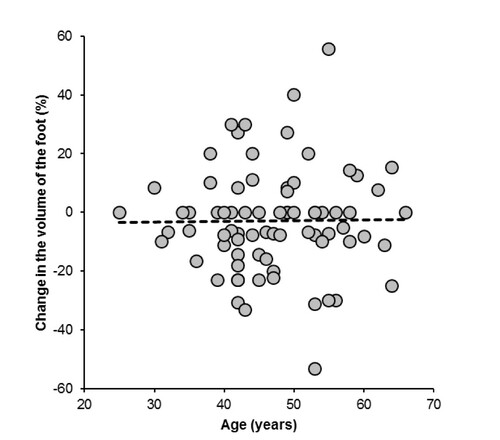
Figure 10 The change in the volume of the right foot was not associated with the age of the subjects ( r = 0.01, p = 0.91).