Figures & data
Table 1 Age and anthropometric measurements in Brazilian Jiu-Jitsu fighters assigned to the PG and RG
Table 2 Muscle and liver injury markers measured before (PRE) and after the match (POST)
Figure 1 Experimental design. Before the experiment, the athletes were subjected to a four-day LCD as described in the Materials and Methods. Blood was collected before the athletes received supplementation (PRE). Warm-up and exercise protocols were performed, followed by six blood collections immediately after exercise (POST; 1, 3, 5, 7 and 10 min).
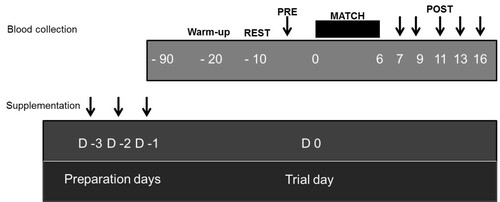
Figure 2 Blood ammonia concentration increases after a high-intensity exercise in an arginine supplementation-dependent manner. A six-minute Jiu-Jitsu match was performed after a three-day LCD by athletes who had received either arginine (RG, Δ) or a placebo (PG, ●). Blood was collected before and after exercise and treated as described in the Materials and Methods. Control, n = 23; Arginine, n = 16. (*) denotes that the average ± SE is different from the pre-exercise values; (#) denotes a difference between the two experimental groups. The calculated area under the curve was 3397 μmol/L·min-1 for the placebo group and 2366 μmol/L·min-1 for the arginine group.
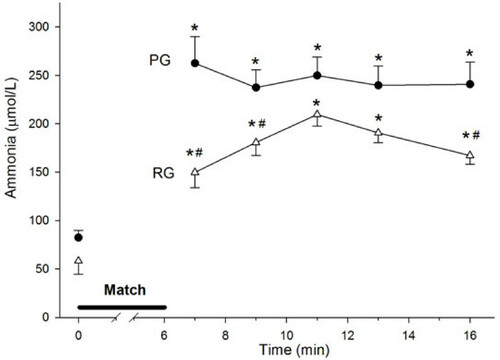
Figure 3 Glucose increases in response to exercise in a supplementation-independent manner (A). Neither supplementation nor exercise affects urea (B) or urate (C) after intense exercise. Control, n = 23 (PG, ●); Arginine, n = 16 (RG, Δ). (*) denotes that the average ± SE is different from the pre-exercise values.
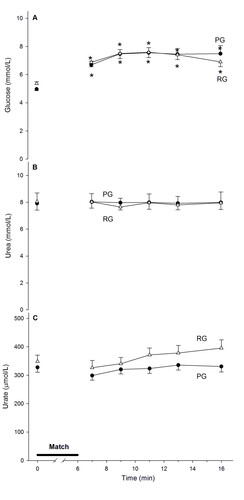
Figure 4 White blood cell counts increase (A) after intense exercise without changes in packed cell volume (B). Control, n = 23 (PG, ●); Arginine, n = 16 (RG, Δ). (*) denotes that the average ± SE is different from the pre-exercise values. The absolute pre-exercise WBC counts are 5.9 ± 0.2 cells × 109/L for the PG and 6.4 ± 0.5 cells × 109/L for the RG; the packed cell volumes are 47.5 ± 0.6% for the PG and 46.6 ± 0.6% for the RG.
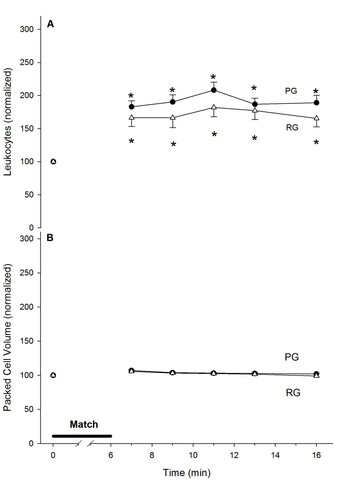
Figure 5 Granulocyte counts in response to exercise and supplementation. Basophils (A); eosinophils (B); neutrophils (C). Control, n = 23 (PG, ●); Arginine, n = 16 (RG, Δ). (*) denotes that the average ± SE is different from the pre-exercise values; (#) denotes a difference between the experimental groups. The absolute pre-exercise values for basophils are 2.6 ± 0.4 × 10⁷ cells /L for the PG and 1.9 ± 0.9 × 10⁷ cells /L for the RG; for eosinophils, 1.8 ± 0.3 × 10⁸ cells /L for the PG and 2.0 ± 0.5 × 10⁸ cells /L for the RG; and for neutrophils, 3.1 ± 0.2 × 10⁹ cells /L for the PG and 2.7 ± 0.4 × 10⁹ cells /L for the RG.
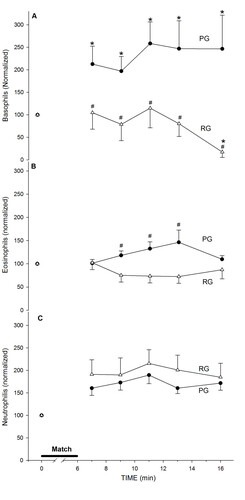
Figure 6 Exercise induces an increase in lymphocytes in an arginine supplementation-dependent manner. Control, n = 23 (PG, ●); Arginine, n = 16 (RG, Δ). (*) denotes that the average ± SE is different from the pre-exercise values. The absolute pre-exercise values are shown within the graphs. The absolute pre-exercise values for lymphocytes are 2.2 ± 0.1 × 10⁹ cells /L for the PG and 2.9 ± 0.3 × 10⁹ cells /L for the RG (no statistically significant difference, p = 0.07).
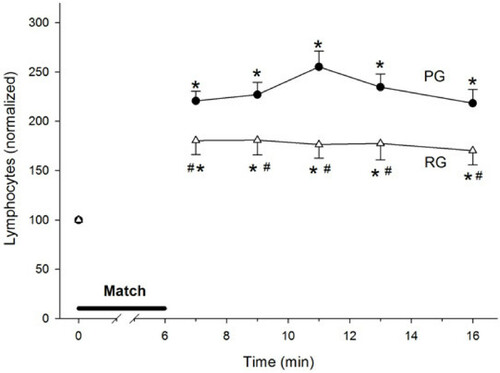
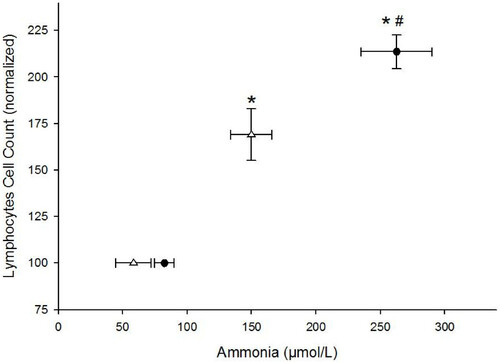
Figure 7 Ammonemia increase is related to the blood lymphocyte count. The lymphocyte count is plotted against ammonemia. (*) denotes that the average ± SE is different from the pre-exercise values; (#) denotes a difference between the experimental groups. Pearson correlations indicate that the relationship between the lymphocyte count and ammonemia is indirect. The lymphocyte increases were normalized to pre-fight levels to ensure a better understanding of the results. Control, n = 23 (PG, ●); Arginine, n = 16 (RG, Δ).