Figures & data
Table 1 Physical and physiological characteristics of the subjects
Table 2 Performance during the event.
Figure 1 Evolution of the intensity, expressed as % of maximum heart rate (HR max ), during the event. * Statistical difference (P < 0.05) mean intensity between the first relay compared with the sixth and seventh relay.
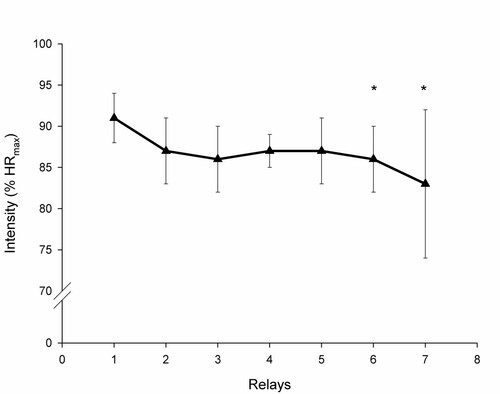
Table 3 Macronutrient intake during the event.
Table 4 Fluid, sodium and caffeine intake and body mass loss during the event.
Figure 2 Main fluids used for hydration and their average consumption during the event.
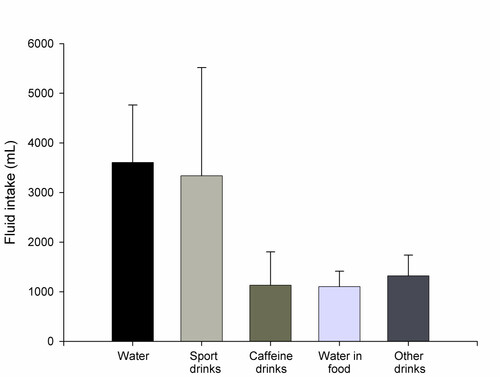
Table 5 Energy balance during the event.
Table 6 Main food and beverages sources of energy and nutrients during the event.
Supplemental material