Figures & data
Table 1 Baseline characteristics, performance data, clinical chemistry and nutrition data of 23 trained men 1
Table 2 Composition of the standardized breakfast 3 hours prior to the strenuous triple step test ergometry
Figure 1 CONSORT diagram.
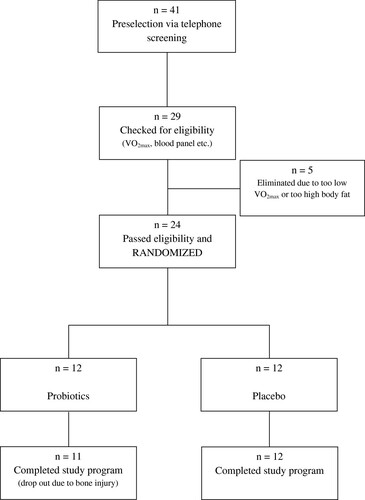
Figure 2 Stool concentrations of zonulin in trained men before and after 14 weeks of treatment. Pro with probiotics supplemented group, Plac placebo group, Tx treatment, wk week; n = 11 (probiotic supplementation), n = 12 (placebo). Values are means ± SD. There was a signficant difference between groups after 14 wk of treatment: PTx < 0.05 (ANOVA).

Figure 3 Plasma concentrations of carbonyl groups bounded on protein in trained men before and after 14 weeks of treatment, and pre/post a triple step test cycle ergometry. Pro with probiotics supplemented group, Plac placebo group, Ex exercise, Tx treatment, wk week; n = 11 (probiotic supplementation), n = 12 (placebo). Values are means ± SD. There was a significant differences from pre to post exercise (except “Pro wk14”): PEx < 0.05; and a tendential difference between groups after 14 wk of treatment: PTx < 0.1 (ANOVA).
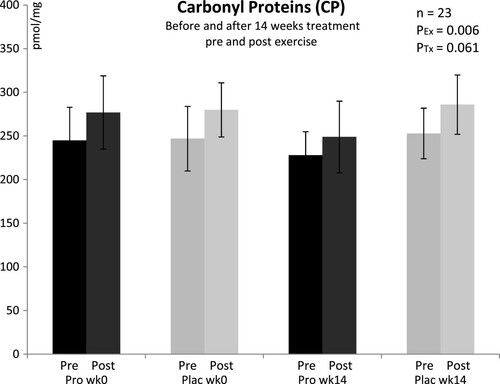
Figure 4 Plasma concentrations of tumor necrosis factor-alpha in trained men before and after 14 weeks of treatment, and pre/post a triple step test cycle ergometry. Pro with probiotics supplemented group, Plac placebo group, Tx treatment, wk week; n = 11 (probiotic supplementation), n = 12 (placebo). Values are means ± SD. There was a tendential difference between groups after 14 wk of treatment: PTx < 0.1 (ANOVA).
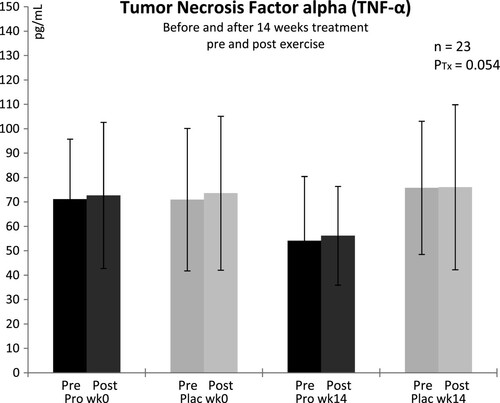
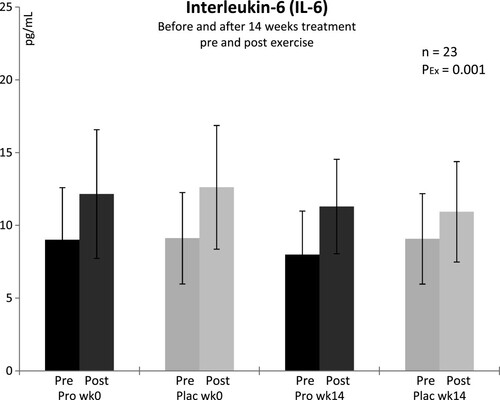
Figure 5 Plasma concentrations of interleukin-6 in trained men before and after 14 weeks of treatment, and pre/post a triple step test cycle ergometry. Pro with probiotics supplemented group, Plac placebo group, Ex exercise, wk week; n = 11 (probiotic supplementation), n = 12 (placebo). Values are means ± SD. There were significant differences from pre to post exercise: PEx < 0.05 (ANOVA).