Figures & data
Figure 1 The study design. FD= food diary, ND= normal diet, LPVD= low-protein vegetarian diet, M1= VO2max cycle ergometer test, M2 and M3= Cycle ergometer tests after the LPVD and ND.
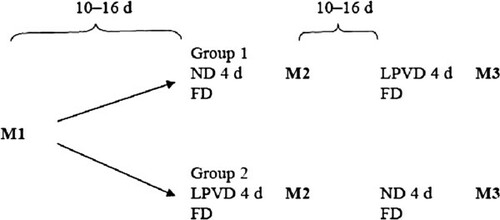
Table 1 Energy and nutrient content of normal diet (ND) and low-protein vegetarian diet (LPVD)
Table 2 Plasma pH and [HCO 3 - ] at rest and during cycle ergometer tests
Table 3 Independent variables of acid–base balance at rest and during cycle ergometer tests
Table 4 Workload, duration and heart rate of every stage during cycle ergometer tests
Table 5 VO 2 , VCO 2 , VE and RQ during cycle ergometer tests
Figure 2 Oxygen consumption during cycle ergometer tests after normal diet (ND) and low-protein vegetarian diet (LPVD). *= p<0.05; ***= p<0.001.
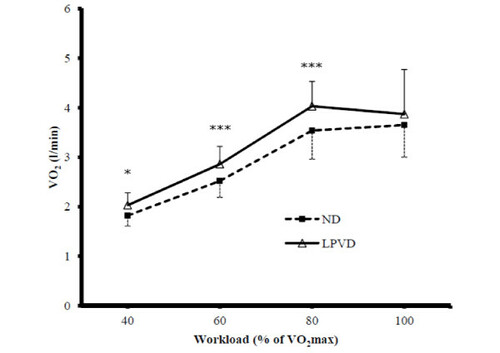
Table 6 Carbohydrate and fat metabolites and albumin in blood at rest and during cycle ergometer tests