Figures & data
Table 1 Summary of cycling time trial performance data: performance time and power output
Figure 1 Relative change in rectal temperature (a) and heart rate (b) throughout the experimental trial. Significant time effects from t=−65 min before TT (arrow) are denoted by dark symbols. Significant time effect from t=−180 min to t=−150 min following drink ingestion with and without glycerol ingestion denoted by alpha (α). Significant effects of precooling treatment (1; PC and 2; PC+G) compared with CON are denoted by a star symbol (*1,*2, respectively). Significant interaction between PC and PC+G treatments are denoted by a hash (#) symbol.
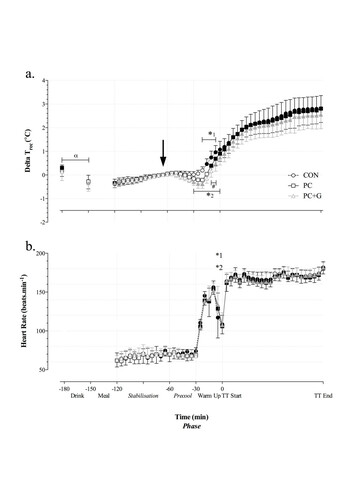
Table 2 Fluid balance
Figure 2 Volume of urine output (a) and urine specific gravity (b) throughout the experimental trial. Significant time effects from t=−150 min before TT are denoted by dark symbols. Significant treatment effect of PC+G compared with CON denoted with star symbol (*2). Time trial denoted by black bar.
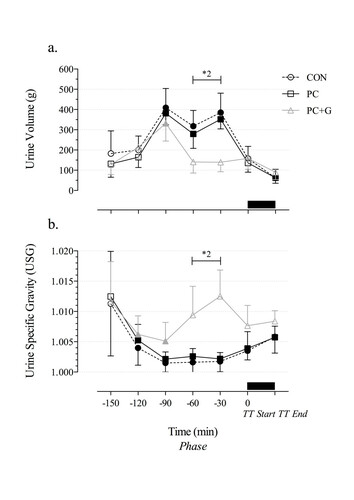
Figure 3 Subjective ratings of comfort. Thermal comfort (a), stomach fullness (b). and rating of perceived exertion (c). Significant time effects from t=−65 min before TT are denoted by dark symbols. Significant effects of precooling treatment (1; PC and 2; PC+G) compared with CON are denoted by a star symbol (*1,*2, respectively).
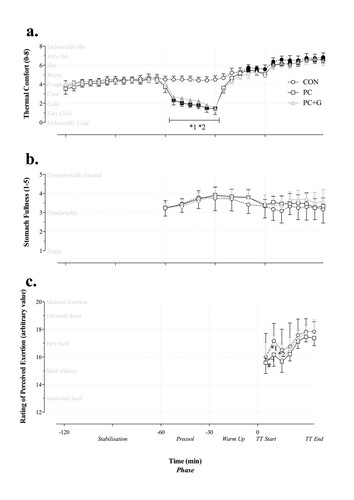
Table 3 Subjective information on completion of time trials