
Figures & data
Figure 1 Baseline subtracted serum testosterone levels in placebo- and Resettin®/MyTosterone™-treated participants. Shown are the total serum testosterone levels from participants after 3, 7 and 14 days of 800 mg/day placebo (a) or Resettin®/MyTosterone™, or 1200 mg/day placebo or Resettin®/MyTosterone™ (b) as determined by ELISA. Each experimental group had between 9 and 10 participants, and results are indicative of one trial. Error bars denote standard deviation of the experimental mean.
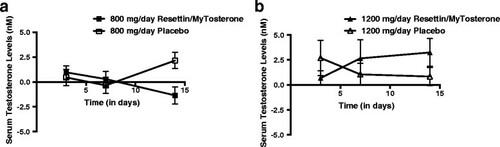
Figure 2 Baseline subtracted serum E2 levels in placebo- and Resettin®/MyTosterone™-treated participants. Shown are the serum E2 levels from participants after 3, 7 and 14 days of 800 mg/day placebo or Resettin®/MyTosterone™ (a), or 1200 mg/day placebo or Resettin®/MyTosterone™ (b) as determined by ELISA. Each experimental group had between 9 and 10 participants, and results are indicative of one trial. There was a statistically significant reduction in the average serum E2 concentration of the 1200 mg/day Resettin®/MyTosterone™ treatment group compared to that of the 1200 mg/day placebo control group (ANOVA-2; p<0.05). Error bars denote standard deviation of the experimental mean. An asterisk (*) indicates statistical significance.
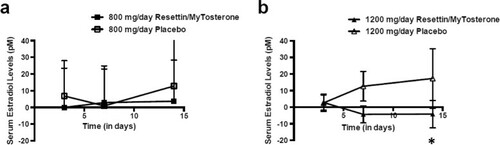
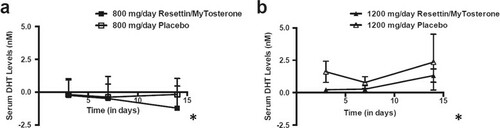
Figure 3 Baseline subtracted serum DHT levels in placebo- and Resettin®/MyTosterone™-treated participants. Shown are the serum DHT levels from participants after 3, 7 and 14 days of 800 mg/day placebo or Resettin®/MyTosterone™ (a), or 1200 mg/day placebo or Resettin®/MyTosterone™ (b) as determined by ELISA. Each experimental group had between 9 and 10 participants, and results are indicative of one trial. There was a statistically significant decrease in the DHT levels in the 800 mg/day and 1200 mg/day Resettin®/MyTosterone™ treatment group compared to their respective placebo control groups (ANOVA-RM; p<0.05). Error bars denote standard deviation of the experimental mean. An asterisk (*) indicates statistical significance.