
Figures & data
Figure 1 Consort diagram of study enrollment.
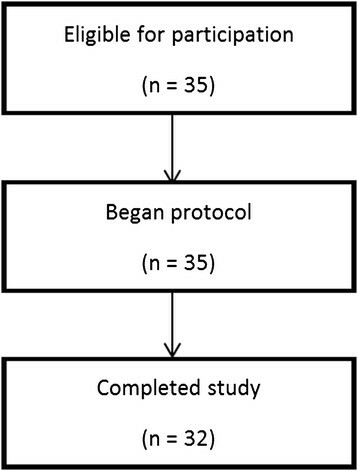
Figure 2 Outline of testing sessions.
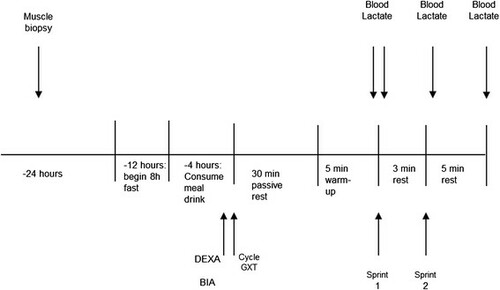
Table 1 Muscle carnosine, creatine, phosphocreatine, and total creatine over 4 weeks
Table 2 Changes in body weight, body composition, and body water
Table 3 Aerobic exercise capacity results observed among groups
Table 4 Blood lactate results observed during the maximal exercise test
Table 5 Anaerobic capacity repeated sprint performance results
Figure 3 Wingate anaerobic capacity peak power and rate of fatigue results. Data are means ± SD. BA signifies beta-alanine only group; BAC represents beta-alanine and creatine combined group; CRE represents the creatine only group; and, PLA represents the placebo group. * represents p < 0.05 difference between PLA and BA, BAC, or CRE groups. † represents p < 0.05 difference from Wingate 1 baseline while ‡ represents p < 0.05 difference from Wingate 2 baseline.
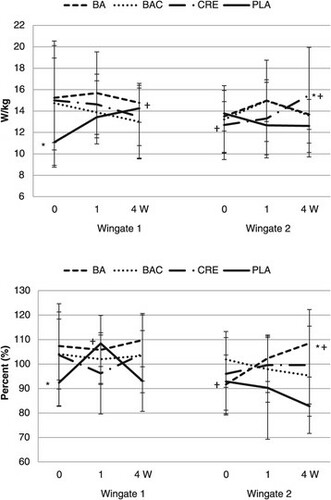
Table 6 Effect size calculations