
Figures & data
Figure 1 Organogram of the experimental protocol. The experiment was performed over 30 days with all animal groups: Day 0 – 6 were the adaptation period without charge (white bars); day 7–25 of training without the use of B. virgilioides, day 26 – 30 (5 days with intake of the extract B. virgilioides) after initiating RT. At day 31 the animals were euthanized.
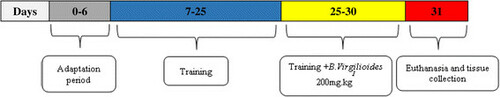
Table 1 Resistance training protocol
Figure 2 Percentage of antioxidant activity at different concentrations of B. virgilioides HEE. (A). Kinetic behavior of HEE at a concentration of 25 μg/mL to reduce DPPH free radical (B). Results are expressed as the mean ± SD. The statistical difference between the concentrations was determined using one-way ANOVA, followed by Bonferroni post-hoc test. Different letters on the graph stand for a statistical difference between the concentrations of HEE (p <0.05). All experiments herein were performed in triplicate.
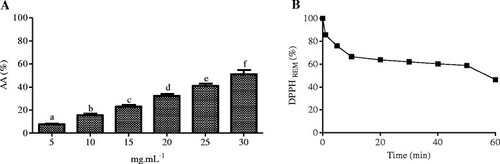
Figure 3 Effect of HEE (50 μg/mL) on lipid peroxidation induced by AAPH (A) and FeSO 4 (B). The results are shown as the concentration of malondialdehyde formed (nmol/mL). Values are expressed as the mean ± SD. Different letters on the graph stand for statistical difference between the groups. The statistical analysis was carried out using one-way ANOVA, followed by Bonferroni post-hoc test (p <0.05). All experiments were performed in triplicate.

Figure 4 Chromatographic profile of HEE and the respective spectra of the prominent peaks. The experimental 5:100% water/methanol condition gradient, measured at a wavelength of 250 nm - 350 nm with the absorption spectra of UV/Vis prominent peaks (A) of spectra, and segmented (B) for each peak: Peak 1 - band “A” 271 nm, and band “B” = 334 nm; Peak 2 - band “A” 271 nm, and band “B” 336 nm; Peak 3 - band “A” 269 nm, and band “B” 334 nm; Peak 4 - band “A” 270 nm, and band “B” 335 nm.

Figure 5 Effect of HEE on plasma and muscular lipid peroxidation induced by high-intensity exercise. (A) refers to plasma samples and (B) to muscular tissue from all animal groups: trained group (TG), trained Bowdichia virgilioides group (TBVG), control group (CG), and B. virgilioides group (BVG), each consisting of eight animals. The values represent the mean ± SD. Different letters indicate significant differences between groups (p <0.05). The statistical differences were determined using one-way ANOVA, followed by Bonferroni post-hoc test. All experiments were performed in triplicate.

Figure 6 Effect of HEE on the oxidation induced by high intensity exercise. (A) refers to samples of plasma and (B) to muscular tissue from all animal groups: trained group (TG), trained Bowdichia virgilioides group (TBVG), Control group (CG) and Group Bowdichia virgilioides group (BVG), each consisting of eight animals. The values represent the mean ± standard deviation (SD). Different letters stand for significant differences between groups (p <0.05). The statistical differences were determined using one-way ANOVA followed by Bonferroni post-hoc test. All experiments were performed in triplicate.
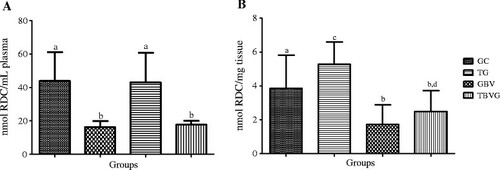
Table 2 Serum concentrations of tissue damage enzymes in UI/L