
Figures & data
Table 1 Contents of each protein per the 0.19 g protein dose of each respective protein
Figure 1 Effects of different protein feedings on skeletal muscle anabolism markers. Legend: Effects of each protein on gastrocnemius p-mTOR (Ser2481) (panel a), p-p70s6k (Thr389) (panel b), p-rps6 (Ser235/236) (panel c), p-4E-BP1 (Thr37/46) (panel d), and muscle protein synthesis (MPS) (panel e). Data are presented as means ± standard error (CTL n = 12–14 per bar, protein groups n = 6–8 per bar). One-way ANOVAs with a Fisher’s LSD post hoc test were performed and significant between-feeding differences are represented with different superscript letters (p < 0.05). Panel f: Example digital images of Akt-mTOR substrates of CTL rats and 70 W/30E-fed rats 180 min post-gavage. Panel g: Representative digital images of puromycin integration into muscle protein (SUnSET determination of MPS).
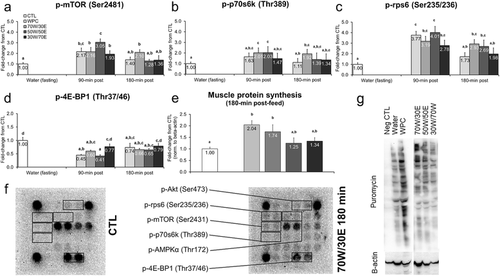
Figure 2 Effects of different proteins on post-treatment gastrocnemius hypertrophy-related mRNA expression patterns. Legend: Effects of each protein on gastrocnemius MSTN mRNA (panel a), Akirin-1/Mighty mRNA (panel b), p21Cip1 mRNA (panel c), Atrogin-1 mRNA (panel d), MuRF-1 mRNA (panel e), and IGF-1Ea mRNA (panel f). Data are presented as means ± standard error (CTL n = 12–14 per bar, protein groups n = 6–8 per bar). One-way ANOVAs with LSD post hoc test were performed and significant between-feeding differences are represented with different superscript letters (p < 0.05).
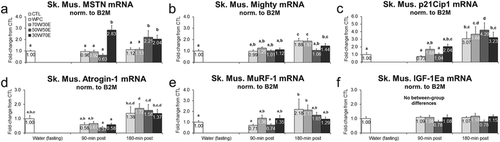
Figure 3 Effects of different proteins on post-treatment expression of skeletal muscle metabolic markers. Legend: Effects of each protein on gastrocnemius p-Akt (Ser473) (panel a), gastrocnemius p-AMPKα (Thr172) (panel b), gastrocnemius PGC-1α mRNA (panel c), gastrocnemius GLUT-4 mRNA (panel d), and gastrocnemius CPT1B mRNA (panel e). Data are presented as means ± standard error (CTL n = 12 per bar, protein groups n = 6–8 per bar). One-way ANOVAs with a Fisher’s LSD post hoc test were performed and significant between-treatment differences are represented with different superscript letters (p < 0.05).
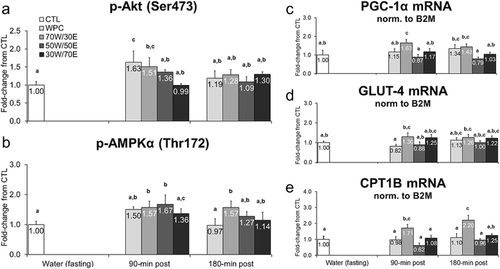
Figure 4 Effects of different proteins on post-treatment lipolysis markers. Legend: Effects of each protein on omental adipose tissue (OMAT) p-HSL (Ser563) (panel a), subcutaneous adipose tissue (SQ) p-HSL (Ser563) (panel b), SQ cAMP tissue concentrations (panel c), serum free fatty acid concentrations (panel e), SQ PGC-1α mRNA (panel f), and SQ UCP3 mRNA (panel g). Data are presented as means ± standard error (CTL n = 12–14 per bar, protein groups n = 6–8 per bar). One-way ANOVAs with a Fisher’s LSD post hoc test were performed and significant between-feeding differences are represented with different superscript letters (p < 0.05). Panel d: representative Western blotting images 180 min post-treatment in OMAT and SQ tissues.
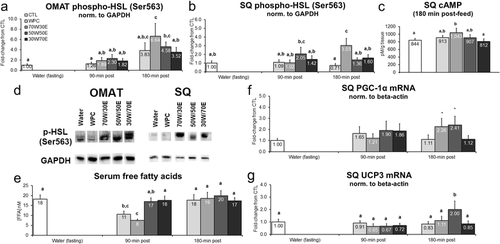
Figure 5 Effects of different proteins on post-treatment lipolytic/thermogenic hormone markers. Legend: Effects of each protein on serum epinephrine (panel a), norepinephrine (panel b), and triiodothyronine (T3) concentrations (panel c). Data are presented as means ± standard error (CTL n = 12–14 per bar, protein groups n = 6–8 per bar). One-way ANOVAs with a Fisher’s LSD post hoc test were performed and significant between-treatment differences are represented with different superscript letters (p < 0.05).
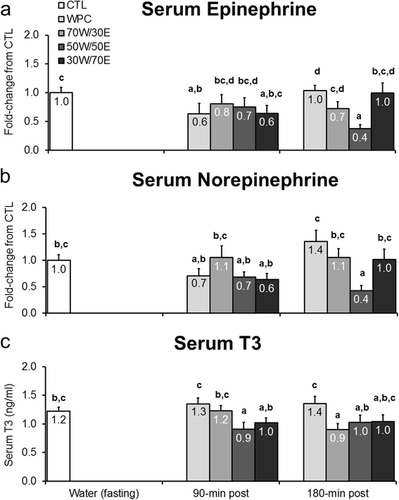
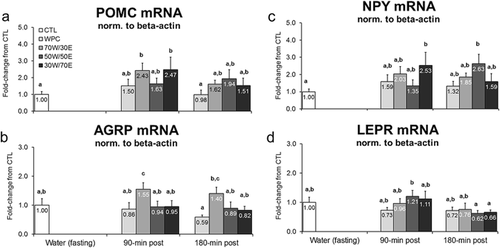
Figure 6 Effects of different proteins on post-treatment mRNA expression of satiety-related genes. Legend: Effects of each protein on hypothalamic proopiomelanocortin (POMC) mRNA (panel a), agouti-related peptide (AGRP) mRNA (panel b), neuropeptide Y (NPY) mRNA (panel c), and leptin receptor (LEPR) mRNA (panel d). Data are presented as means ± standard error (CTL n = 13 per bar, protein groups n = 5–8 per bar). One-way ANOVAs with a Fisher’s LSD post hoc test were performed and significant between-feeding differences are represented with different superscript letters (p < 0.05).