
Figures & data
Table 1 Primers and probes in RT-qPCR
Table 2 Body and organ weights, and food intake
Fig. 1 Basal indirect calorimetry. a Average RER, (b) total VO2, (c) total CHO, and (d) total FAT of mice at rest during a 24h light-dark cycle. Values are presented as means ± SEM (n = 8). Significant differences among groups of different diets were determined by one-way ANOVA followed by Newman-Keuls post-hoc test. Dissimilar alphabets indicate significant differences (p < 0.05). Significant differences between groups of the same diet having different training states were determined by Student’s t-test (*, p < 0.05)

Fig. 2 Exercise indirect calorimetry. a,b RER, (c,d) VO2, (e,f) CHO, and (g,h) FAT of mice during a 60min treadmill run presented as time-course changes (a,c,e,g) and average and total values (b,d,f,h). No significant difference in each time point and average and cumulative values was observed among groups of different diets as assessed by one-way ANOVA while significant differences were observed between groups of the same diet having different training status as assessed by Student’s unpaired t-test (*, p < 0.05). Values in both types of graph are presented as means ± SEM (n = 9-13)

Fig. 3 Treadmill endurance performance. a Running population plotted against time, (b) time-to-exhaustion, (c) distance and (d) work of mice subjected to running-to exhaustion test. Each point in A represents an individual mouse. For the bar graphs, data are presented as means ± SEM (n = 9-13). Significant differences among groups of different diets were determined by one-way ANOVA followed by Newman-Keuls post-hoc test. Dissimilar alphabets indicate significant differences (p < 0.05). Significant differences between groups of the same diet having different training states were determined by Student’s t-test (*, p < 0.05)
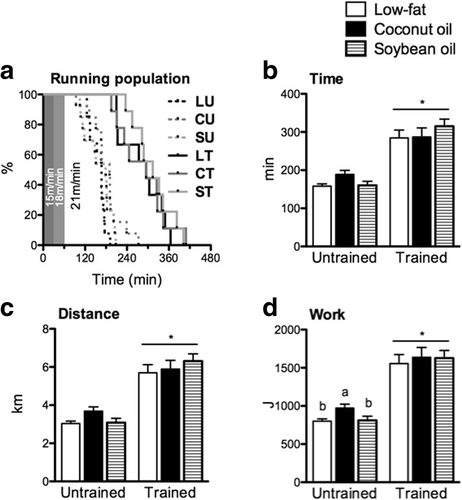
Table 3 Pre- and post-exercise metabolites
Fig. 4 Muscle mitochondrial enzyme activities. a CS, (b) β-HAD, (c) SCOT, and (d) mitochondrial Complex IV activities of gastrocnemius from untrained and trained mice. Data are presented as means ± SEM (n = 8). Significant differences among groups of different diets were determined by one-way ANOVA followed by Newman-Keuls post-hoc test. Dissimilar alphabets indicate significant differences (p < 0.05). Significant differences between groups of the same diet having different training states were determined by Student’s t-test (*, p < 0.05)

Fig. 5 Muscle mRNA expression. a Pgc1a, (b) Ppara, (c) Pparb/d, (d) Erra, (e) Errb, (f) Errg, (g) Lpl, (h) Cpt1b, (i) Glut4, (j) Fatp1, and (k) Myh2 expression in gastrocnemius from untrained and trained mice. Data are presented as means ± SEM (n = 8). Significant differences among groups of different diets were determined by one-way ANOVA followed by Newman-Keuls post-hoc test. Dissimilar alphabets indicate significant differences (p < 0.05). Significant differences between groups of the same diet having different training states were determined by Student’s t-test (*, p < 0.05)

Fig. 6 Muscle protein expression. a Representative immunoblot along with corresponding Ponceau S stained membrane, and (b) quantified GLUT4 protein expression in gastrocnemius from untrained and trained mice. Signals from proteins of interest were compared to total Ponceau S signal. Data are presented as means ± SEM (n = 8). No significant differences among groups of different diets were observed as determined by one-way ANOVA. Significant differences between groups of the same diet having different training states were determined by Student’s t-test (*, p < 0.05). Samples were processed simultaneously and each group was represented in each gel. Location and molecular weight of proteins were confirmed by visibly colored protein standards (invisible to chemiluminescent detection). Results were data pooled from 6 gels
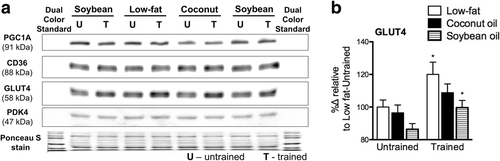
Fig. 7 Liver mitochondrial enzyme activities. a AACD, (b) AACT, (c) Complex IV and (d) β-HAD activities of liver from untrained and trained mice. Data are presented as means ± SEM (n = 8). Significant differences among groups of different diets were determined by one-way ANOVA followed by Newman-Keuls post-hoc test. Dissimilar alphabets indicate significant differences (p < 0.05). Significant differences between groups of the same diet having different training states were determined by Student’s t-test (*, p < 0.05)

Fig. 8 Liver mRNA expression. a Ppara, and (b) Cpt1a expression in liver from untrained and trained mice. Data are presented as means ± SEM (n = 8). Significant differences among groups of different diets were determined by one-way ANOVA followed by Newman-Keuls post-hoc test. Dissimilar alphabets indicate significant differences (p < 0.05). Significant differences between groups of the same diet having different training states were determined by Student’s t-test (*, p < 0.05)
