
Figures & data
Table 1 Body mass, lean mass, fat mass, total body water throughout the study period
Fig. 1 Delta changes relative to baseline (PRE) in lean mass in each group at 4 weeks (a) and 8 weeks (b) following heavy resistance training and supplementation. Mean ± SEM, † Significantly different from Placebo (p < 0.05)
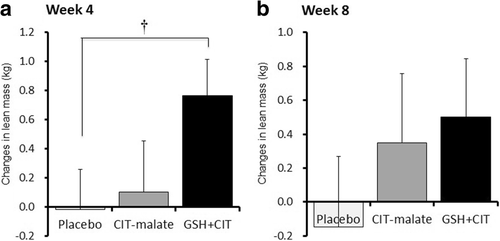
Table 2 Muscle strength for the bench press and leg press exercises throughout the study period
Fig. 2 Relationship of changes in lean mass with 1RM bench press (a) and 1RM leg press (b) for all three groups at weeks 4 and 8. For the bench press, significant correlations were observed at 4 and 8 weeks (p < 0.05). However, for the leg press a significant correlation was only observed at week 4 (p < 0.05). Mean ± SEM
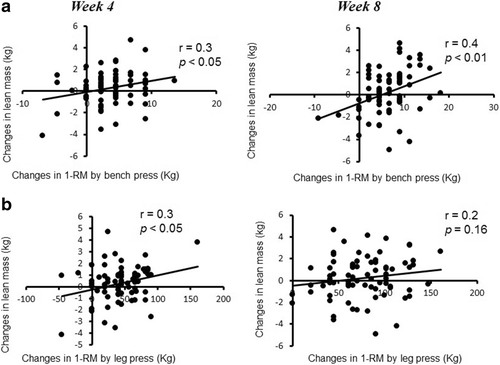
Fig. 3 Relationship of changes in lean mass with 1RM bench press in each group throughout the study period. A significant correlation was observed only for GSH + CIT (p < 0.05). Mean ± SEM
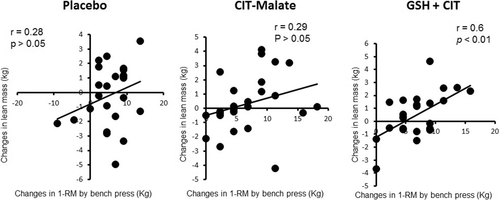
Table 3 Dietary composition throughout the study period
Table 4 Changes in blood biochemical and hematological markers before and after resistance training and supplementation