
Figures & data
Table 1 Anthropometric and Demographic Characteristics of the Subjects Displayed by Diet Group
Fig. 1 a Mean WHOQOL-BREF-Domain Scores of Women Displayed by Diet Group. Note. Results are presented as mean ± SD. p – p-value for differences between groups. η2 – effect size. b. Mean WHOQOL-BREF-Domain Scores of Men Displayed by Diet Group. Note. Results are presented as mean ± SD. p – p-value for differences between groups. η2 – effect size
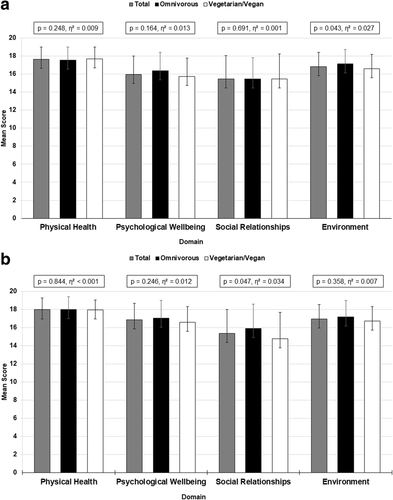
Fig. 2 a Mean WHOQOL-BREF-Domain Scores of Women Displayed by Race Distance. Note. Results are presented as mean ± SD. p – p-value for differences between groups. η2 – effect size. b Mean WHOQOL-BREF-Domain Scores of Men Displayed by Race Distance. Note. Results are presented as mean ± SD. p – p-value for differences between groups. η2 – effect size
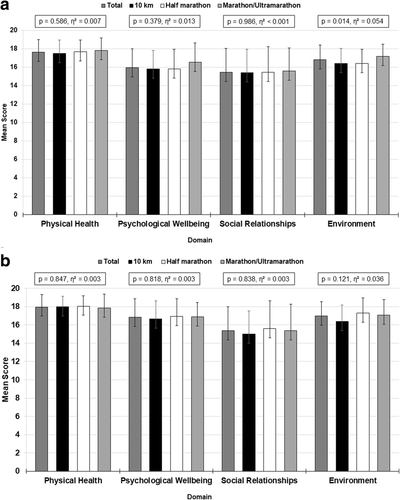
Table 2 Mean Likert-Scores of the WHOQOLBREF-Items Displayed by Diet Group
Table 3 Mean Likert-Scores of the WHQOLBREF-Items Displayed by Race Distance