Figures & data
Table 1 Subject demographics
Fig. 1 PRE vs POST Δ TTE. Results are represented as boxplots with * P < 0.05. Data represents mean ± SD. POST BA TTE was significantly longer than PRE (14.6 ± 3.8mins vs 11.1 ± 2.4mins, respectively, P = 0.04); PL TTE did not significantly change (PRE, 9.4 ± 1.4mins; POST, 8.7 ± 2.4mins, P = 0.7). PL, Placebo; BA, β-Alanine

Fig. 2 PRE vs POST lactate production. Results are represented as boxplots. Data represent mean ± SD. No change in lactate production within either group. When comparing treatments, POST lactate production expressed a trend as BA produced more lactate than PL (P = 0.06). PL, Placebo; BA, β-Alanine

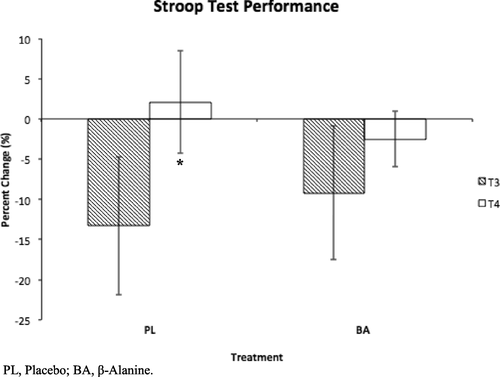
Fig. 3 Stroop test performance. Percent change from PRE to POST time to perform the Stroop test task of identifying the colors. Positive change represents a decline in executive function. Data represent mean ± SD. Results are represented with * P < 0.05. BA mediated the decline in executive function following recovery from fatigue (T3 vs T4) seen within PL (P = 0.04). PL, Placebo; BA, β-Alanine