
Figures & data
Table 1 Characterization of study participants
Fig. 1 OPLS-DA model comparing elite athletes belonging to different groups of sports (athletics, boxing, cycling, football, rowing, rugby and swimming). a A score plot showing the class-discriminatory component (x-axis) versus orthogonal component (y-axis) among all sport groups. b A score plot from an updated OPLS-DA model featuring combined groups (group 1: football and boxing, group 2: rugby, rowing, athletics, swimming and cycling). c The corresponding loading plot from the updated model showing clusters of xenobiotics at opposite sides of group one or group either ends of the discriminatory component along the x-axis
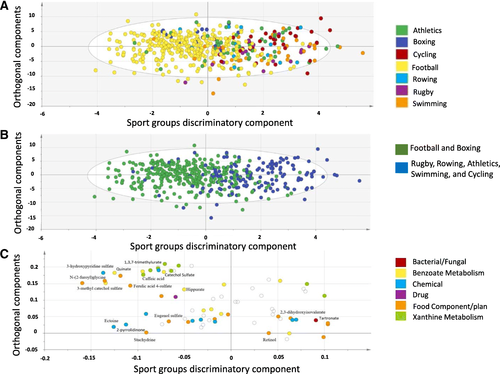
Table 2 Metabolites differentiating between different sport groups
Fig. 2 Box plots summarizing levels of significantly different metabolites among the seven studied groups (AT: Athletics, BX: Boxing, CY: Cycling, FB: Football, RO: Rowing, RG: Rugby, SW: Swimming). These levels are corrected for model’s covariates, they are mean-shifted and scaled since they represent the residuals from a repeated linear model that omits the sport group while featuring only covariates

Fig. 3 GGM sub-networks of xenobiotics that varied significantly among sport groups. Changes are represented by nodes with sizes proportional to – (log p value) (larger nodes indicate more significant association with certain sport group). Colors represent classes of metabolites (Benzoate metabolites in yellow, chemicals in green, food components in red and xanthine metabolites in blue)
