Figures & data
Table 1 Descriptive characteristics of national and international triathletes
Table 2 Cardioventilatory parameters and load obtained in incremental test
Table 3 Comparison between beetroot juice (BJ) supplementation and placebo (PL) experimental condition on cardiorespiratory variables
Fig. 1 Slow component (ΔVO2 mL . min− 1) analysis during the constant load test in: a Beetroot juice (J) experimental condition at first ventilatory threshold (VT1); b Placebo (PL) experimental condition at VT1 c Beetroot juice (BJ) experimental condition at second ventilatory threshold (VT2); d PL experimental condition at VT2. Data are provided as mean and standard deviation. There were no significant differences between both experimental conditions (BJ vs. PL) in VT1 and VT2

Fig. 2 Differences between beetroot juice (BJ) and placebo (PL) at first ventilatory threshold (VT1), second ventilatory threshold (VT2) and in the total time of the test (VT1 + VT2), measured in: a Cycling efficiency (CE); b Gross efficiency (GE); c Lactate; d Total time until exhaustion. Data are provided as mean and error bars as 95% confidence intervals. There were no significant differences between both experimental conditions BJ vs. PL
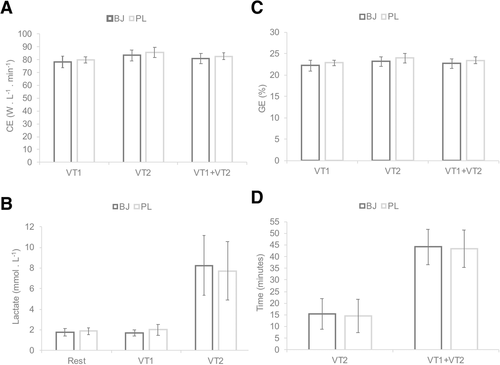
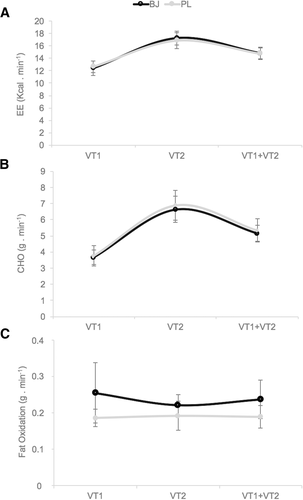
Fig. 3 Differences between beetroot juice (BJ) and placebo (PL) at first ventilatory threshold (VT1), second ventilatory threshold (VT2) and in the time to completion (VT1 + VT2), measured as: a Energy expenditure (EE); b Carbohydrate oxidation (CHO); c Fat oxidation. Data are provided as mean and error bars as 95% confidence intervals. There were no significant differences between both experimental conditions BJ vs. PL