Figures & data
Fig. 1 A typical HPLC chromatogram of GMCT showing peaks of Rutin and α-mangostin. The elution was detected at 255 nm. The elution profile is plotted in arbitrary units (AU) versus elution time (min). RT indicates retention time
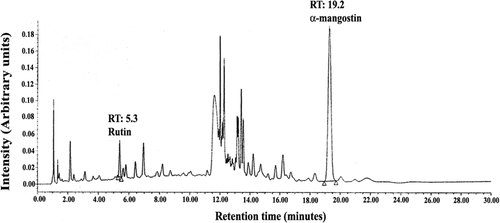
Fig. 2 The Consort flow diagram presents enrollment, randomization, follow-up, and analysis of the double-blind placebo controlled parallel group trial
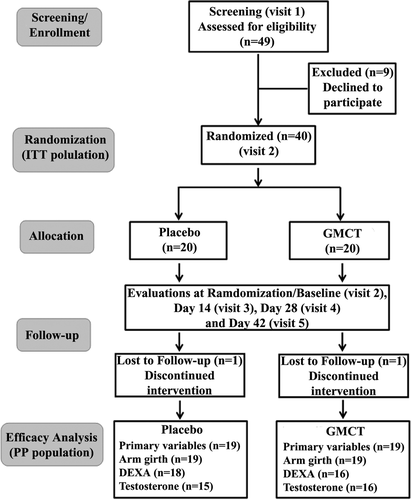
Fig. 3 GMCT improves swimming parameters of the weight-loaded mice in a Forced Swim test. Swimming time (a) and the total distance covered (b) are graphically presented. The groups presenting CMC, GMCT-150, GMCT-300, and OXY are described in Methods. Each bar represents mean ± SD (n = 6). *p < 0.05 compared with the vehicle control group (CMC), using unpaired t-test
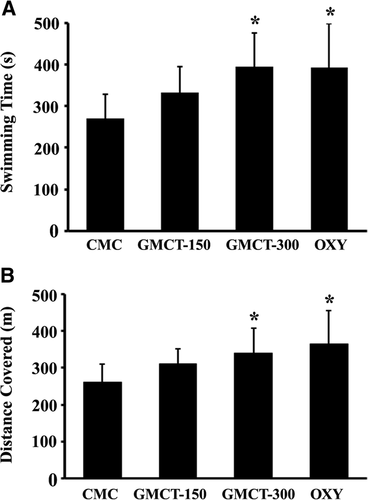
Fig. 4 GMCT positively modulates muscle parameters in mice. The groups presenting CMC, GMCT-150, GMCT-300 and OXY are described in Methods. a Bar diagram represents the change in grip strength in experimental animals (n = 6). Each bar represents mean ± SD of strength in Newton per gram of body weight as mentioned in Results. *p < 0.05 compared with the vehicle control group (CMC), using unpaired t-test. b Representative photomicrographs show Hematoxyline-Eosin stained cross-sections of the gastrocnemius muscles of the different group of animals, as indicated. Bar indicates 50 μm
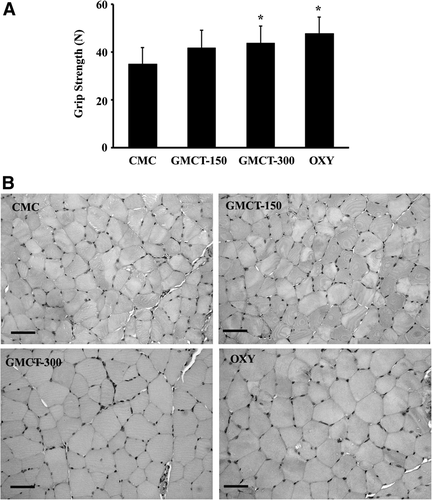
Table 1 Baseline demographic characteristics of the participants in placebo and GMCT supplemented groups
Table 2 Per protocol analysis of mean changes from baseline scores of exercise performances in placebo vs. GMCT supplemented subjects
Table 3 Gradual improvements of the strength and endurance parameters in placebo and GMCT supplemented subjects during the study
Fig. 5 GMCT supplementation improves anthropometric measurements in resistance-trained participants. a Changes from baseline mid-upper arm circumference (placebo, n = 19; GMCT, n = 19) and (b) changes from baseline body composition (placebo, n = 18; GMCT, n = 16) at post-intervention are graphically presented. Each bar represents mean ± SD. *p < 0.05, comparison between changes in placebo and GMCT using ANCOVA
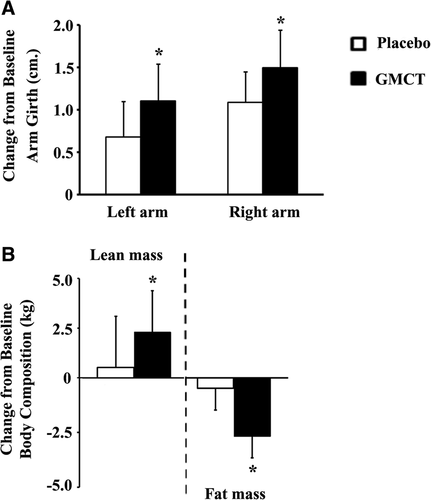
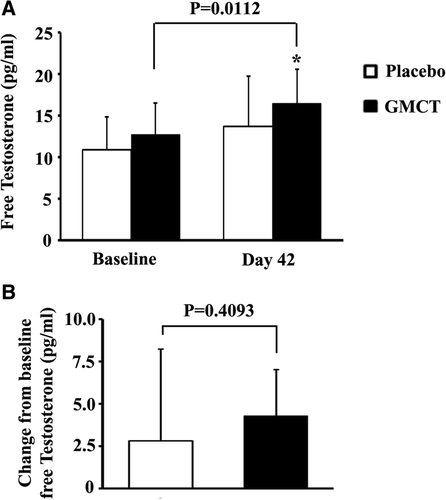
Fig. 6 Effect of GMCT supplementation on free testosterone level in the circulation of resistance-trained participants. a Bars represent mean ± SD of free testosterone concentrations in placebo (n = 15) and GMCT (n = 16) groups at baseline and post-intervention. b Bars represent mean ± SD of changes from baseline free testosterone concentrations in placebo and GMCT groups at post-intervention. * indicates significance in an unpaired t-test