Figures & data
Fig. 1 Summary of training volume across IET. Total physical activity (Sum of time spent in: light, moderate, vigorous, and very vigorous intensity) is represented by the columns and time spent in each classification of physical activity is represented by the lines. Data is presented in average minutes per day during each week of training
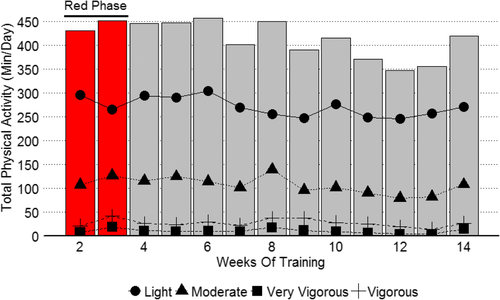
Fig. 2 Summary of dietary intake in IET soldiers. Caloric intake (Calories per day), individuals who did not meet the recommendation were those who were in a negative energy balance; Protein, recommendation ≥1.5 g/kg body weight; Carbohydrate, recommendation ≥6 g/kg of body weight; Fat ≥25% total kcal intake, represent macronutrient intakes of IET soldiers in comparison to the recommended intake for active individuals [Citation22]
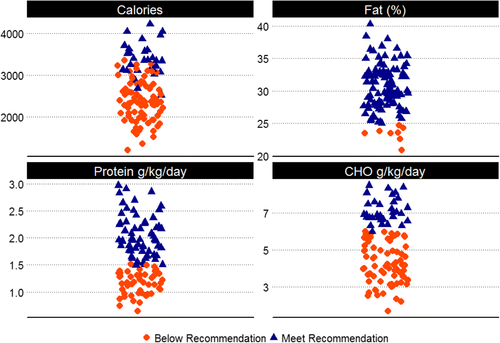
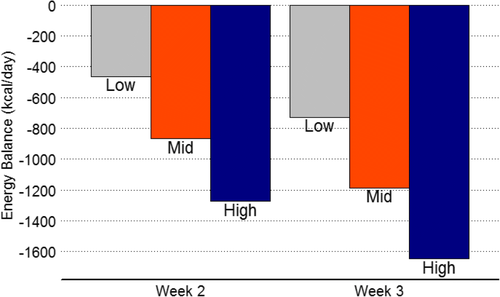
Fig. 3 Energy balance estimate during red phase of IET. Energy balance is presented using three different MET values related to each classification of physical activity. Low, (Light = 2, Moderate = 3, Vigorous = 6). Mid, (Light = 2.5, Moderate = 4.5, Vigorous = 7.5); High, (Light = 2.99, Moderate = 5.99, Vigorous = 8.99) Very Vigorous was 9 METs across all estimates