Figures & data
Fig. 1 Study Design
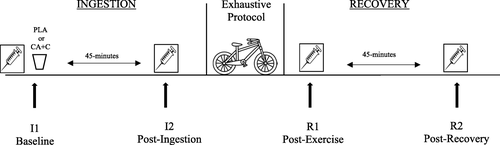
Table 1 Participant Characteristics (N = 10)
Fig. 2 Plasma Insulin. Plasma insulin is presented as Means ± SD and expressed in International Units (mU·L− 1). * = significantly different from I1. + = Significantly different from PLA. # = Significantly different from R1
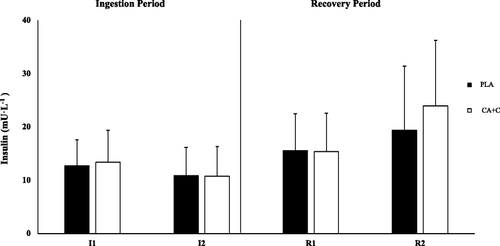
Fig. 3 Blood Glucose. Blood glucose is presented as Means ± SD and expressed in mg/dL. * = significantly different from I1. + = Significantly different from PLA. # = Significantly different from R1
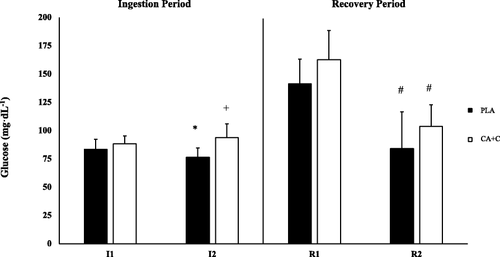
Fig. 4 Plasma Triglycerides. Plasma triglycerides are presented as Means ± SD and expressed in mg/dL. * = significantly different from I1. + = Significantly different from PLA. # = Significantly different from R1
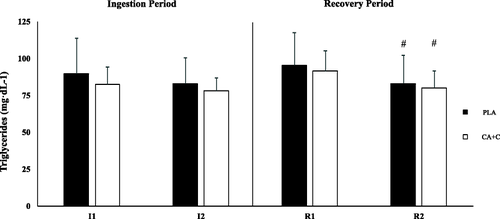
Fig. 5 Plasma Epinephrine. Plasma epinephrine is presented as Means ± SD and expressed in nmol/L. * = significantly different from I1. + = Significantly different from PLA. # = Significantly different from R1
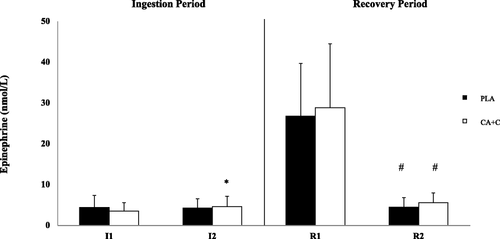
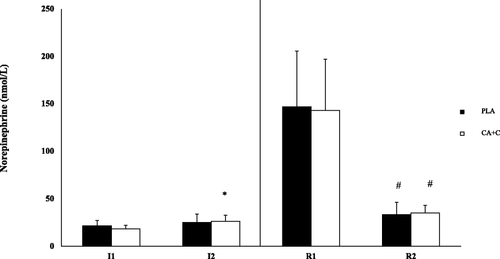
Fig. 6 Plasma Norepinephrine. Plasma norepinephrine is presented as Means ± SD and expressed in nmol/L. * = significantly different from I1. + = Significantly different from PLA. # = Significantly different from R1