Figures & data
Fig. 1 Experimental Design. Using a counterbalanced design, subjects were randomly assigned to either the control (maple flavored water) or maple water (DrinkMaple, MW) for their first visit. Baseline measures of hydration (nude body weight, analog and digital USG, saliva and urine osmolality, urine volume, urine color), perceptual measures of thirst and fatigue, HR and HRV. Following cycling to ~ 2% Dehydration, the same battery of measures were taken immediately post-exercise, 0.5, 1.0, and 2.0 h post consumption of assigned beverage. Participants returned no less than 48 h later to complete the trial in the other condition
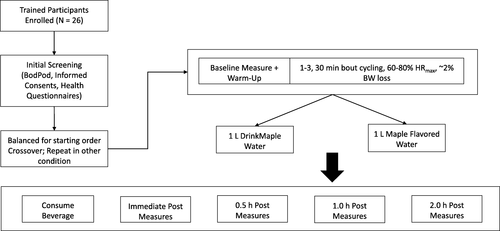
Table 1 Participant Characteristics
Fig. 2 Measurements of Hydration Status at Baseline, 2% Exercise-Induced Dehydration, and after ingestion of Control or Maple Water in Males and Females (n = 26). a ∆Body weight, b Urine Color (1–8 scale), c Digital Urine Specific Gravity (USG), d Analog USG, e Urine Osmolality, f Saliva Osmolality. Data are mean ± SD. # p < 0.05 main effect for sex, *p < 0.05 main effect for time, #* p < 0.05 of interaction sex by time

Fig. 3 Measurements of Urine Volume (a) and Cumulative Urine Volume (0.5–2.0 h, b) at Baseline, 2% Exercise-Induced Dehydration, and after ingestion of Control or Maple Water in Males and Females (n = 26). Data are mean ± SD. # p < 0.05 main effect for sex,*p < 0.05 main effect for time

Fig. 4 Measurement of Thirst Sensation and Fatigue at baseline, 2% Exercise-Induced Dehydration, and after ingestion of either Control or Maple Water in Males and Females (n = 26). Data are mean ± SD. *p < 0.05 main effect for time, † p < 0.05 interaction of condition by time, and #* p < 0.05 of interaction sex by time

Fig. 5 Measurements of Heart Rate and Heart Rate Variability at baseline, 2% Exercise-Induced Dehydration, and after ingestion of either Control or Maple Water in Males and Females (n = 26). a Heart Rate, b RMSSD, c Natural Log Transformed RMSSD (LnRMSSD), d SDNN. Data are mean ± SD.*p < 0.05 main effect for time, #* p < 0.05 interaction of sex by time
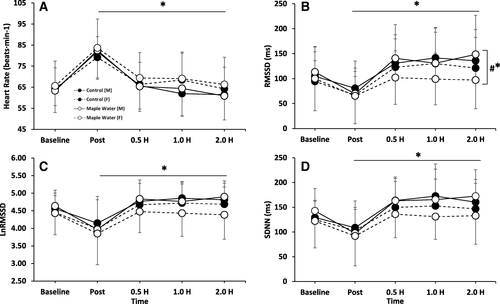
Table 2 Nutritional content of Control (Maple Flavored Bottle Water) and Maple Water (MW)
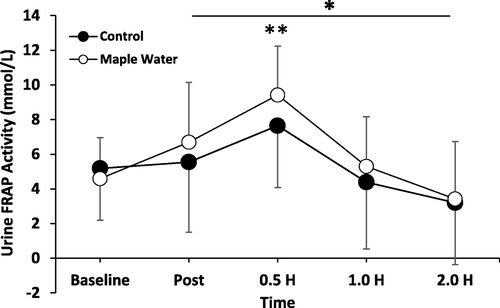
Fig. 6 Measurements of Urinary Antioxidant Potential at baseline, after exercise at 2% Dehydration, and after ingestion of either Control or Maple Water (n = 14). Data are mean ± SD. *p < 0.05 main effect for time. **p < 0.05 control vs. maple water at time of peak