Figures & data
Table 1 Fluid comparison of selected nutrients
Fig. 1 Experimental design and protocol. Dehydration Protocol: Euhydrated participants were randomly assigned in a counterbalanced fashion to one of three groups (Deep, Sports, or Spring). Prior to data collection, participants executed 1 of 3 peak torque extension maneuvers to obtain a baseline value. Following peak torque extension, parameters were collected (indicated in the panel labeled DATA COLLECTION) and exercise was initiated using a stationary bicycle under moderate heat stress (32–35 °C). Exercise was continued for 15 min followed by collection of parameters. If participants did not achieve 3% body mass loss, exercise was reinitiated for another 15 min. This cycle was continued until participants lost a minimum 3% of body mass and participants were not allowed to evacuate or intake any fluids. Upon completion of the Dehydration Protocol, participants immediately executed the second (2) of 3 peak torque extension maneuvers to obtain a post-exercise value and transitioned to the Hydration protocol. Hydration protocol: Participants rehydrated with 1 of 3 fluids, in 2 phases. Phase 1: Participants consumed fluids at ½ of the total volume lost. 10 min following fluid intake a saliva sample was collected. Sample collection continued at 5-min intervals until 30 min from the time of fluid intake. Phase 2: The remaining amount (½ of the total volume lost) of fluid was ingested followed by saliva sample collection 10 min later. Saliva collection continued at 5-min intervals until 45 min from the second fluid intake. Immediately following the final saliva collection, participants executed the third [Citation3] of 3 peak torque extension maneuvers to obtain a post-hydration value.
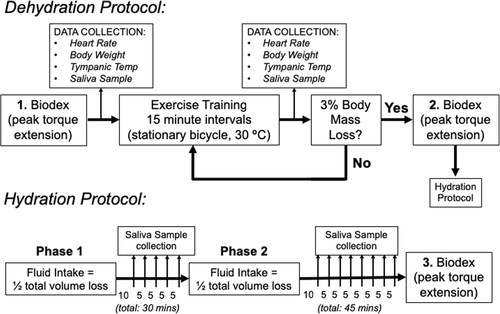
Fig. 2 Salivary osmolality as a function of body mass loss. Salivary osmolality (Sosm mmol/Kg) was plotted as a function of change in body mass percentage in each of the three groups: Deep (a), Sports (b) or Spring (c) groups. Individual measures of salivary osmolality were averaged from the three trials. Salivary osmolality (Sosm mmol/Kg) was significantly elevated (*p < 0.0001; Females and Males) at Peak compared to Baseline collected as either Stimulated (d) or Unstimulated (e). No differences between Females and Males were detected, nor was there an interaction between sex and time point of data collection. Two-way ANOVA with post-hoc Bonferroni analysis. Data presented as mean ± S.D
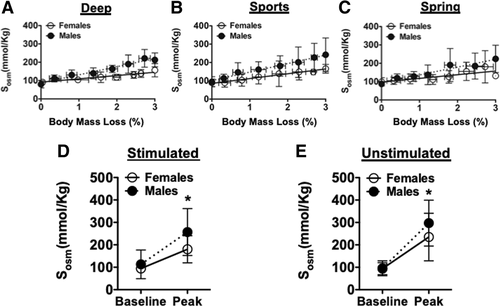
Fig. 3 Time required to achieve target dehydration indicated by a 3% body mass loss. a Bar graph representation of the time required to reach a loss of body mass that was at least 3% of starting body mass in the Deep, Sports and Spring groups for Females and Males. A repeated measures two-way ANOVA indicated no significant differences in Time to 3% Body Mass Loss among the experimental groups but did find a significant effect of sex (p < 0.0125). b Averaged values across experimental groups for Time to 3% Body Mass Loss in Females and Males. (*p < 0.034; Females vs. Males). c Averaged values across experimental groups for Sweat Rate (ml/min; total volume lost in ml over total time to 3% body mass loss;) in Females and Males. (*p < 0.0083; Females vs. Males). Two-way ANOVA with post-hoc Bonferroni analysis. Data presented as mean ± S.D
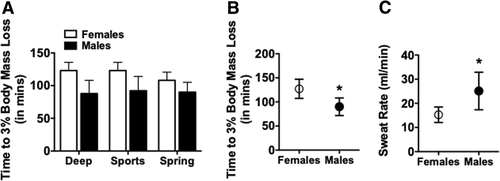
Fig. 4 Rate of salivary osmolality recovery during fluid hydration following dehydrating exercise protocol. Salivary osmolality was fit with a single exponential decay (one-phase decay) starting with peak salivary osmolality against real time. a representative one-phase decay fit to salivary osmolality recovery during fluid hydration. Fluid was ingested in two phases indicated by the arrows. b-d Bar graph representation of one-phase decay fit parameters (K, tau (τ), and τ 1/2) in Females and Males from the Deep, Sports and Spring groups. A repeated-measures two-way ANOVA determined a significant impact of fluid on rate parameters of hydration that was not impacted by sex. Post-hoc Bonferroni analysis indicated a significant difference in the Deep group compared to both Sports and Spring groups (*p < 0.0001 compared to Sports and Spring groups). One-phase decay equation: Sosm = (Sosm(peak)- Sosm(baseline))Kt + Sosm(baseline); K = rate constant, tau (τ) =1/K, and τ 1/2 = half-time Sosm recovery. Data presented as mean ± S.D
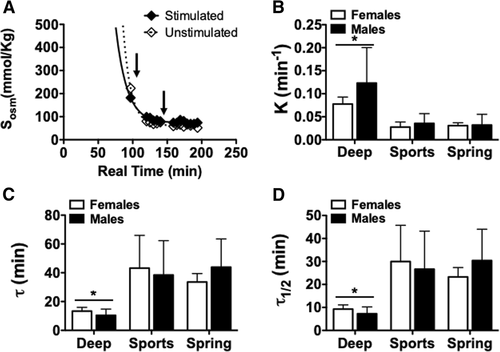
Table 2 The return of Sosm to baseline levels during rehydration
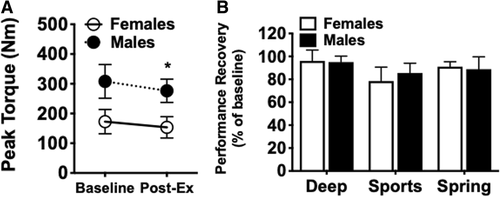
Fig. 5 Impact of dehydration and hydration on lower body muscle performance. Peak torque extension using Biodex™ was determined prior (Baseline) to and immediately following exercise (Post-Ex) and rehydrating protocol. a Averaged values across experimental groups for peak torque extension (Nm) at Baseline and Post-Ex in Females and Males. The dehydrating exercise protocol significantly impacted peak torque (p = 0.0048), which was dependent on sex (p = 0.0005) and the exercise protocol (p = 0.0002) by two-way ANOVA. Post-hoc Bonferroni analysis indicated a significant difference in Baseline and Post-Ex for Males only (p = 0.0117). the Deep group compared to both Sports and Spring groups (*p = 0.01; Females vs. Males). b Bar graph representation of the recovery in peak torque extension at the completion of the hydration protocol expressed as percentage of baseline peak torque (Peak Torqueend/Peak Torquebase X 100). There is a main effect of rehydrating fluid (p = 0.0157) by two-way ANOVA. Data presented as mean ± S.D