
Figures & data
Table 1 Genotype
Table 2 Physical characteristics and training history
Table 3 Baseline characteristics according to FTO genotype for the three SNPs
Table 4 Nutrition
Table 5 Body composition
Table 6 Segmental fat mass changes
Fig. 1 The change in body weight (post weight minus pre weight). There were no between-group differences. Data are expressed as the mean ± SD
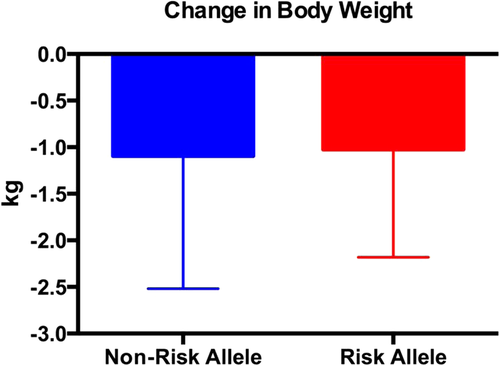
Fig. 2 The change in fat mass (post fat mass minus pre fat mass). There were no between-group differences. Data are expressed as the mean ± SD
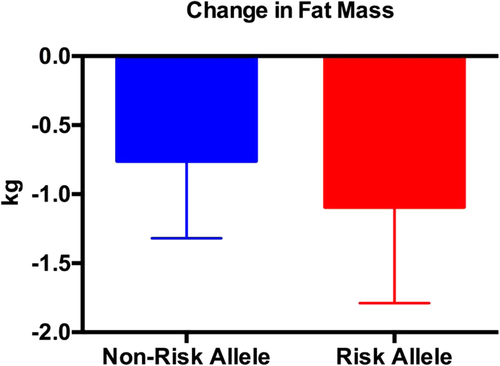
Fig. 3 The change in fat-free mass (post fat-free mass minus pre fat-free mass). Fat-free mass did not change in either group. There were no between-group differences. Data are expressed as the mean ± SD
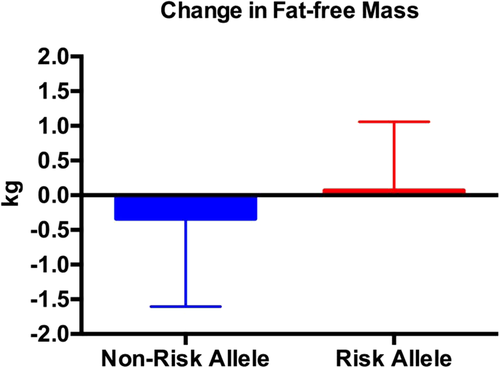
Fig. 4 The change in percent body fat (post % body fat minus pre % body fat). The Risk Allele group experienced a greater change in % body fat versus the Non-Risk Allele group (p < 0.05). Data are expressed as the mean ± SD
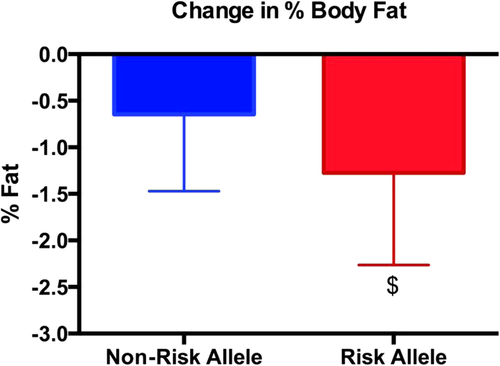
Fig. 5 The change in total body water (post total body water minus pre total body water). There weas no change in total body water. There were no between-group differences. Data are expressed as the mean ± SD
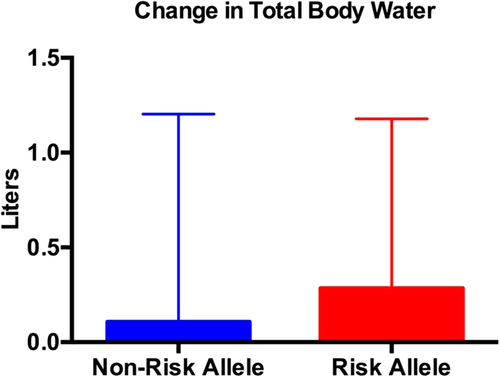
Table 7 Biomarkers
Availability of data and materials
The author should be contacted for data requests.